What is Business Intelligence?
Business intelligence (BI) is a technological infrastructure that compiles, parses, and turns data into helpful or actionable information.
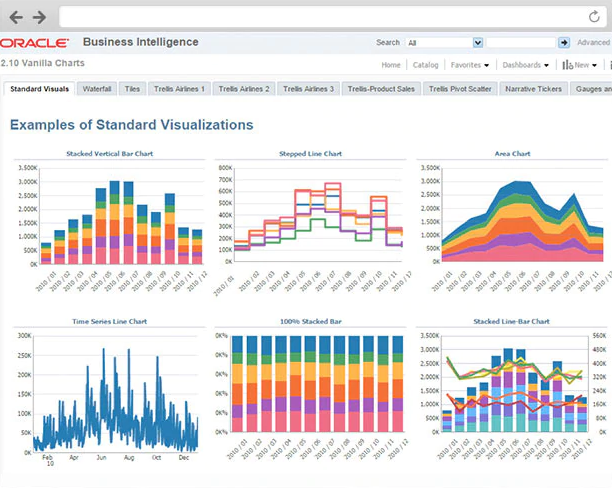
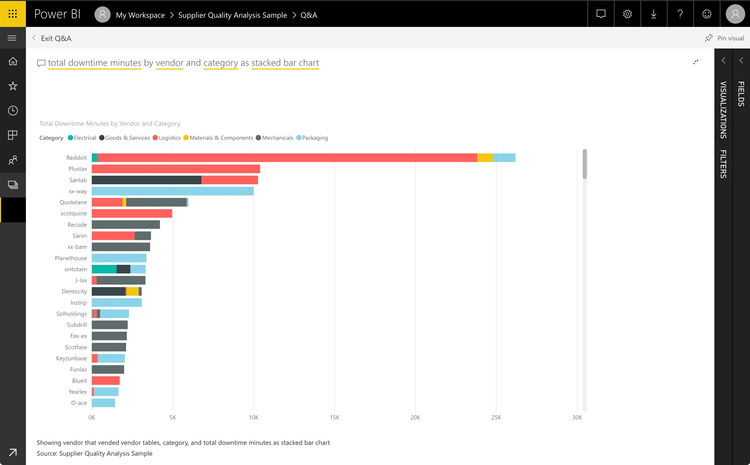
BI software helps source, analyze, and present business data through visualizations like charts, reports, and dashboards. These tools help managers make data-driven decisions to improve workflows and strategies.
How Business Intelligence Works
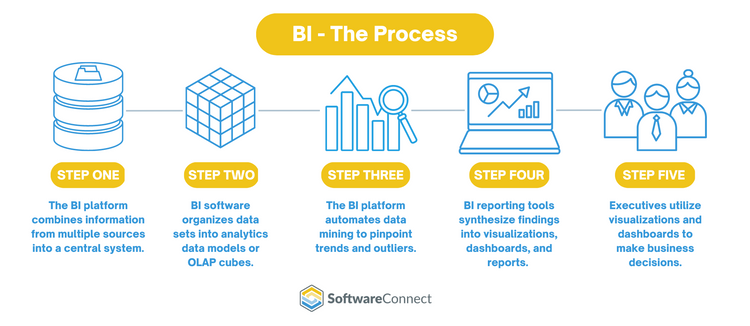
Initially, IT organizations conducted business intelligence through static queries and delayed reporting cycles. Modern BI facilitates self-service so workers across departments can access and share current data. In addition, BI tools automate five key steps to synthesize raw data into decisive insights:
Step 1
The BI platform combines information from multiple data sources into a central system, like the cloud, an application, or a data warehouse.
Step 2
BI uses the extract, transform, and load (ETL) method to aggregate structured and unstructured data into a comprehensive set. The software organizes data sets into analytics data models or OLAP (online analytical processing) cubes. An OLAP cube is a multi-dimensional data structure produced for rapid analysis.
Step 3
Business intelligence software automates data mining to pinpoint trends and outliers. BI utilizes statistical, descriptive, predictive, and exploratory data modeling to forecast trends and recommend next steps based on recurring patterns.
Step 4
BI reporting tools synthesize findings into visualizations, dashboards, and reports. Decision-makers review these graphs, charts, and maps to share results and understand the company’s current state.
Step 5
Executives use data visualizations and dashboards to make business decisions. Current and historical data provide context for business activities. Predictive analysis informs long-term strategies and helps make quick adjustments to existing efforts.
Benefits
BI helps organizations gain a competitive advantage, refining operational processes and making room for innovation. Because BI detects inefficiencies and automates the reporting process, the company can focus on growth and profitable niches in the market. The following are some examples of how BI benefits enterprises:
Optimizes business operations
- Provides a comprehensive view of business processes
- Identifies inefficiencies and growth opportunities
- Connects departments through a centralized hub of data
Improves customer experience
- Identifies recurring customer service issues
- Outlines consumer buying patterns and behavior
- Utilizes machine learning to anticipate customer demand
Monitors real-time company performance
- Presents up-to-the-minute data on marketing and sales efforts
- Accurately measures financial performance
- Provides clear benchmarking for products and processes
Provides governed, accurate data
- Notifies users about data anomalies
- Reduces human error between departments
- Combines internal and external data silos into one location
BI dashboards provide opportunities to review three main data types essential to monitoring performance at a company-wide or product-level scale:
-
Metrics measure the impact of specific processes based on historical data points. They do not establish trends or future goals; they report on past occurrences. Examples include the number of customers gained or lost in the last month or the top-selling products in the past year.
-
Key performance indicators (KPIs) measure a company’s real-time progress toward its most important goals. Popular KPIs include growth in revenue, inventory turnover, operational cash flow, net profit margin, and gross profit margin.
-
Miscellaneous data points encompass granular details that provide valuable insights like consumer demographics, the time certain products are purchased, and customers’ lifetime value.
Business Intelligence Examples
BI plays a critical role in decision-making across industries. The following six examples illustrate how business intelligence benefits stakeholders:
-
Education
School districts and universities can assess student needs through a self-service BI. According to BSchools.org, business intelligence tools help administrators develop programs to increase student retention and graduation rates and facilitate career placement. -
Financial
Financial institutions use business intelligence systems to establish objectives for their bankers. For example, data analysis helps executives determine how many and which type of accounts each banker opened. A BI platform also monitors the amount of new money brought into the institution. -
Food & Beverage
Food and beverage companies analyze customer behavior and market trends to pinpoint when demand is highest. This ensures proper stocking of brick-and-mortar and eCommerce stores, meeting ideal PAR levels in any location. -
Healthcare
Some essential BI tools used in clinical settings include treatment plans based on patient symptoms, facility supply chain management, and follow-up care alerts for patients meeting specific criteria. In healthcare management, administrators track KPIs like staffing shortages, hospital infection rates, and readmission rates. -
Manufacturing
BI solutions utilize predictive analytics to visualize demand and inventory, forecasting potential supply chain disruptions. Manufacturers can prevent bottlenecks with data visualizations showing current inventory levels, pending orders, and reorder points for raw materials. -
Marketing
Data analytics help firms monitor the profitability and performance of marketing campaigns. Marketers can also investigate client behavior, market sentiment toward their firm, and target audiences for specific initiatives.
FAQS
How do BI dashboards differ from reports?
Though both present business analytics to the reader, reports and dashboards differ in significant ways:
Dashboards
- Summarize real-time data
- Visual presentation
- Interactive data
- Web-based
Reports
- Present raw, historical data
- Tabular presentation
- Static data
- Print or web-based
How do Business Intelligence and Business Analytics Differ?
Business Intelligence primarily analyzes historical and current data to understand what has happened within an organization. It focuses on current business operations and helps organizations make informed decisions based on past and present data.
Business Analytics focuses on using historical data to predict future trends. It involves predictive analysis to forecast future events.
Gain a Competitive Edge with BI
Business intelligence solutions help manage big data, monitor KPIs, and forecast trends in your industry. Bring your company to the forefront with a modern analytics platform, intuitive visualization, and self-service capabilities. Explore our Best BI Tools Buyer’s Guide to find the right fit for your enterprise.