Board Intelligent Planning
2 Reviews 3/5 ★ ★ ★ ★ ★A FP&A software that includes business intelligence, performance management and predictive analytics.
Product Overview
Board is designed to empower decision-making in various business contexts. It offers a unified platform for planning, predictive analytics, and business intelligence, enabling companies to leverage their data effectively. By providing a complete view of business information, Board helps organizations gain actionable insights and maintain control over their performance.Pros
- Speedy consolidation between different locations
- Facilitates quick and easy creation of data models for business intelligence.
- Offers easy-to-read reports, enhancing workflow and planning efficiency.
- Provides optimal integration for a wide range of scenarios
Cons
- Formatting issues may arise when exporting data to Excel
- PDF export process is not particularly fast
- Requires consult call for pricing
Target Market
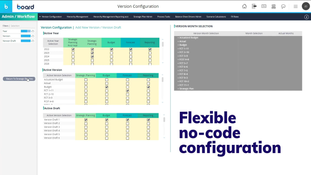
Board is particularly well-suited for large enterprises, as it is commonly used by organizations with over 1,000 employees.Board Intelligent Planning software offers a comprehensive solution for Business Intelligence (BI) and Corporate Performance Management (CPM) without requiring any programming. It features a toolkit approach for quick and customizable application development in BI and CPM, along with an interactive interface that simplifies report and analysis creation.
Initially designed to enhance organizational decision-making efficiency, Board combines BI and CPM tools under a concept called Management Intelligence. After fifteen years, Board remains a leader in integrating BI and CPM, offering a unified technological and functional solution. It includes a range of BI functions (reporting, multi-dimensional analysis, ad hoc querying, dashboarding) and manages various performance processes (budgeting, planning, forecasting, profitability analysis, scorecarding, financial consolidation).
Boards’s analysis capabilities allow easy integration of data from multiple sources, enabling a self-service analysis environment. Features include drill-through and drill anywhere, OLAP slice and dice analysis, what-if and goal-seeking scenarios, business data modeling, and ad hoc queries.
Board Key Features:
- Integrated architecture for reporting, querying, analyzing, and running CPM applications.
- Self-service data view and queries across various data sources.
- User-friendly design for all business or technical skill levels.
- In budgeting, planning, and forecasting, Board enables integrated management of these processes with strategic corporate vision alignment. It offers advanced tools for what-if analysis and goal-seeking and manages scenarios for multi-dimensional simulations.
Key budgeting features include:
- Comprehensive workflow, audit trail, versioning, scenario, and approval status management.
- Automatic allocation of changes across data levels.
- What-if and what-for functions for real-time impact assessments.
- Excel add-in with offline data entry.
- Rolling forecasting and budgeting.
- Simultaneous write-back to databases or data warehouses.
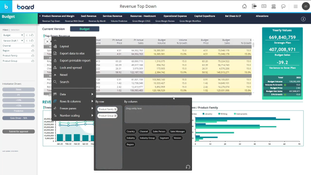
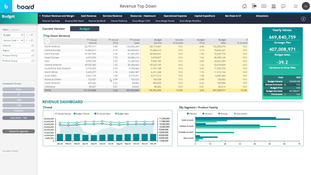
- Board’s dashboard feature offers various data visualization options, such as cockpits, maps, and tables, with advanced graphic animations. It also provides drill-down and drill-through functions for detailed analyses.
Key dashboard features include:
- Various visualization options and self-service dashboard creation.
- Integrated software system for managing data from different core areas.
- For profitability analysis, Board offers a Visual Modeling environment for sophisticated models of cost and earnings allocation. It calculates profitability at various hierarchy levels and includes multi-dimensional “what-if” and “goal-seeking” capabilities.
Key profitability analysis features:
- Flexible and multidimensional modeling.
- Integrated framework for various performance management processes.
- Support for various activity-based costing methodologies.
- Multi-user access and unlimited scenarios for complex models.
- Data extraction and validation from multiple sources.
- Board’s reporting function allows users to create various corporate reports with interactive graphic layouts, using three-dimensional graphs, maps, and animations.
Key reporting features:
- Integrated framework for various reporting and analysis tools.
- Adaptable to any data source and unlimited report authors and consumers.
- Multiple export formats and flexible distribution methods.
- Multi-lingual and conditional alerting capabilities.
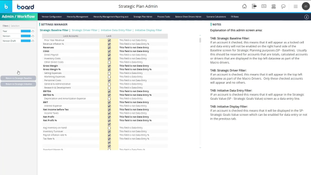
- In scorecarding, Board offers innovative graphic functions for creating Strategy Maps and Scorecards, providing interactive links between KPI visual representation and data.
Key scorecard features:
- Drill-through access to other data sources.
- Alerts and notifications for metric changes.
- Customizable for various scorecarding methodologies.
- Multi-lingual and various visualization options.
- For statutory reporting, Board addresses regulatory compliance challenges by providing a comprehensive CPM approach, integrating performance management with regulatory initiatives.
Key statutory reporting features:
- Integrated framework for performance management processes.
- Single version of the truth for data accuracy.
- Complete process management, including workflow, audit trail, and reporting.
- Drill-through and ad-hoc queries for transparency.
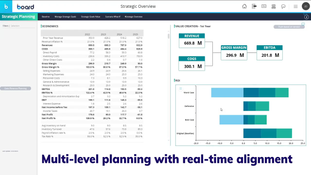
Lastly, in strategy management, Board assists organizations in strategy formulation, translation into action, and execution monitoring. It supports strategy maps, balanced scorecards, and scenario planning and aligns reporting and budgeting with strategic objectives.
Video Overview
Product Overview
Developer Overview
Related Products
User Reviews of Board Intelligent Planning
Write a Review- Automotive
- 11-50 employees
- Annual revenue $1M-$10M
Integration into Sage 100
This is the most frustrating company I have ever dealt with. Example: website goes down all the time, or has features stop working and they want to charge you by the hour to fix things that break. This is on top of paying $1,700/ month for their hosting and a $100,000 implementation fee. Go Else-ware, there can’t be another website company that has customer service as bad as Website Pipeline / Cimcloud
Pros
integration into sage 100
Cons
customer service, lack of ability to fix/maintain a working ecommerce website.
Board allows us to consolidate in a split second
Board allows us to consolidate in a split second! Yes, consolidation can happen with a single button! Yes, consolidation can happen for 48 manufacturing plants and for 85 warehouses! At the beginning I was very skeptical, but I can guarantee you that it works!