Tableau
13 Reviews 5/5 ★ ★ ★ ★ ★A data visualization and BI tool that enables users to analyze large volumes of data effectively.
Product Overview
Tableau is a business intelligence and data visualization tool. It excels in creating easy-to-understand visualizations from complex data, facilitating informed decision-making. Tableau’s user-friendly interface, with drag-and-drop capabilities, allows users with varying technical expertise to create dynamic, interactive reports and dashboards, enhancing data exploration and collaborationPros
- Embedded analytics
- Secure network
- Shareable dashboards
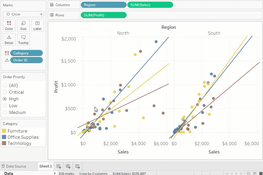
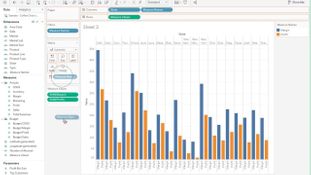
- Easy to track patterns with data visualization
- Intuitive graphic creation
Cons
- Need to have skilled IT staff to create SQL query to pull a dataset
- Relatively expensive with significant associated costs for deployment and training
- Steep learning curve
- Lacked support since Salesforce acquisition
Target Market
Companies in a variety of industries including financial services, IT, healthcare, life sciences, public sector, retail and media. Companies using this software average between 50 and 200 employees with at least $1 million in annual revenue.Tableau is business intelligence software that allows users to connect to data with a few clicks, visualize it, and create interactive, sharable dashboards with a few more. It’s effective for companies upgrading from Excel that require an advanced analytics system.
UPDATE: On 6/10/2019, Salesforce announced the acquisition of Tableau. Salesforce said Tableau will operate independently and under its own brand post-acquisition, with a focus on bringing together CRM and data analytics in the future.
Source: TechCrunch.com
Video Overview
Key Features
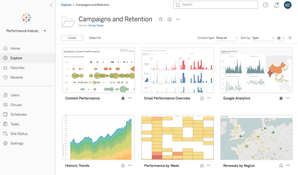
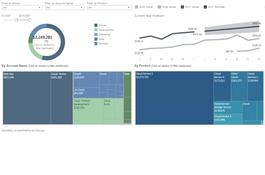
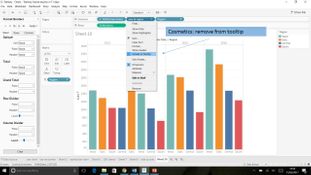
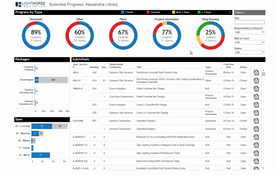
- Dashboards: Comprehensive view of data visualizations with interactive elements. It offers several different layouts and formats with filtering options for customization.
- Collaboration: Teams can share data in real time, including sheets, dashboards, and charts.
- Einstein Insights: Allows businesses to gain insights on performance using contextual data and automated reports.
- Security: Offers usage monitoring and security certification standards like ISO.
- Scalability: The platform features an open architecture allowing for businesses to add modules and add analytics to scale up the software as they grow.
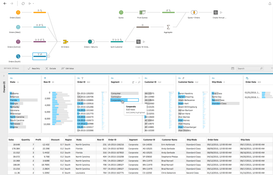
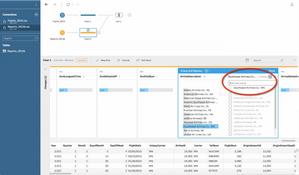
- Data Blending: Integrate data from different sources to compare and contrast on one project.
Embedded Analytics
Embedded Analytics integrates data into external-facing applications to provide analytics, dashboards, and reporting to people outside of the company, such as partners, customers, or suppliers.
Embedded Analytics provides clients with data and lets them customize and integrate it as they please. This allows companies to focus on their work while their customers get the data they desire.
Tableau Pricing
All deployments are billed annually.
- Tableau Creator starts at $75/user/month, billed annually (every deployment requires at least one Creator)
- Tableau Explorer is $42/user/month
- Tableau Viewer is $15/user/month
Enterprise Edition
Tableau offers an enterprise edition that is more advanced for larger companies. The prices are billed annually.
- Enterprise Creator starts at $115/user/month
- Enterprise Explorer is $70/user/month
- Enterprise Viewer - $35/user/month
Product Overview
Developer Overview
Related Products
User Reviews of Tableau
Write a ReviewPeople want to use it
Tableau has evolved from nothing to where we are today because people want to use it. We put Tableau on our robust customer data sets…to quickly ask questions like ‘how many customers have a Freedom and a checking account and use the mobile wallet?’
Tableau Review
We were early adopters of Tableau with version 4.0. Today we have three servers globally and 67 active instances, supporting 25,000 people globally. Tableau is an integral part of how we operate.
Tableau is so great because it talks to all these different softwares
Tableau is so great because it talks to all these different softwares. And for us, this was a big milestone–tying them together and getting text mining into a dashboard. Our analytics staff strives to perform advanced analytics and build predictive models and machine learning solutions that enable the business to move forward.
Insights from our dashboards help us optimize call center operations
Insights from our dashboards help us optimize call center operations to reduce the need for customers to call us multiple times. Monitoring these timely dashboards shows us that as the resolution rate and satisfaction index of customers go up, volumes for calls and dispatches–which are key cost drivers–go down
actively using this data, actively getting insights
In three months, we not only had dashboards, but we had staff actively using this data, actively getting insights, actively taking action, and really making a difference for customers in each of our restaurants. Tableau was the ticket to take all metrics and understanding to that next level.
Creating simplicity in scaling
I think where Tableau has been most helpful with respect to our growth is creating simplicity in scaling. Once data is organized, it’s very easy to add another small multiple in our stack of visualizations related to a specific region.
By building one single network of Tableau dashboards that allows a user to see at the system level how are we doing, how are all of our hospitals doing, and to very rapidly drill down to the individual hospital and nursing unit, and down to a list of the affected patients in that unit, has been helpful for communicating and collaborating around improving many of our KPIs.
Tableau Review
We went from inaccurate reports to a single data source, a single Tableau solution that allows people to go deep or provide high level information. It’s been an incredible way to help us achieve our goals at Schwab.
Unique solution for our customers
Tableau provided ARC’s customers the deep insights, advanced analytics, detailed performance intelligence and competitive benchmarking needed to enhance industry partnerships and operational success. Being able to easily track patterns and trends in sales and analytics embedded into their daily processes delivered a unique solution for our customers.
It’s the best of both worlds
Airline BI offers a nice mix of data visualization and raw numbers … It’s the best of both worlds. Airline BI helps us stay on top of trends with a weekly analysis of agency performance and better understanding of how our O&Ds are performing, as well as monthly cost-of-sale metrics including market share and booking class.
Tableau Review
Our enhanced BI product set was very well received. We now deliver highly valuable information that customers need, give them time to act on it, and cut down on a lot of the noise that interferes with the value inherent in the data.
Our Tableau deployment went viral
Our Tableau deployment went viral. In less than two years, we have 20,000 users. And the reason for this success is because we’ve been able to strike the right balance between empowering the business, enabling better visibility, and instilling trust and governance in the data.
Adoption has been awesome
Adoption has been awesome. We had one user who literally danced when she accessed the dashboard… We helped her put words, ideas, and drawings to life in Tableau that meet her needs.
To really align the product–the end result–with what the end users needed, Tableau was the only thing that would offer the flexibility we were looking for.
amazing data visualization and excellent customer support
Tableau has amazing data visualization and excellent customer support. It can be low cost at first, but this is mostly to get users in the door. Plus we feel Tableau is really only beneficial if you have your data in Excel or a CSV file, which can be uploaded to Tableau very easily. If you need connection to a database, you’ll need to have an IT staff skilled to create the SQL query to pull the dataset.