The Best KPI Dashboard Software

Get the best software for your business. Compare product reviews, pricing below.

Talk with a software advisor
Talk with an advisor
Get a free consultation from an independent expert.
Or, call toll-free: (800) 827-1151
Talk with a software advisor
Talk with an advisor

Popular Products

No products found
SimpleKPI Screenshot

SimpleKPI

★★★★★
★★★★★
(3)
SimpleKPI offers everything you need to monitor and visualize your business metrics. THe simple, easy to understand dashboard takes complex data and turns it into accessible and understandable visuals which can improve organizations performance. Use this software to create powerful top-level summaries of your KPIs to share across your organization. Choose from various charts, graphs, league tables and widgets that help communicate accurate understanding from your data. @youtube Dashboards for
Price Range
   $     $     $     $     $   
   $     $     $     $     $   
Starting Price
$99/month
Client OS
Web
Deployment
Cloud Hosted
Klipfolio Screenshot
Klipfolio is a business intelligence software that provides dashboards and reporting for your business completely in the cloud. You can analyze anything from financial data, marketing data, or sales data. Klipfolio can connected to over 100+ services via hassle-free connectors for popular spreadsheet tools, file types, databases, web applications, and more. Klipfolio provides visual analytics to spot trends and lets you use filters, segments, or trend lines to learn more. You can create custom
Price Range
   $     $     $     $     $   
   $     $     $     $     $   
Starting Price
$49/month
Deployment
Cloud Hosted
Sisense Screenshot
Sisense is a business analytics platform that cleans your data, provides interactive visual analytics, and delivers insights. Sisense provides customized dashboards based on your industry. The solution can grab data from multiple sources, providing a level of analyzing to help you make important decisions, and finally create the visual analytics via dashboards that your reporting desires. Mash Up: Connect and analyze data from multiple sources; Analyze: Personalized dashboards, interactive
Price Range
   $     $     $     $     $   
   $     $     $     $     $   
Starting Price
$4,200/user (perpetual license)
Client OS
Windows, Web
Deployment
Cloud or On-Premises
Fathom Screenshot

Fathom

★★★★★
★★★★★
(3)
Fathom software offers companies powerfully simple financial reporting and analysis. Track business performance at a glance Comprehensive financial intelligence, performance reporting, dashboards and consolidations. Collect KPI data for insights into informed decision making. Fathom integrates seamlessly with QuickBooks, Xero, MYOB & Excel data to provide insightful reports and dashboards. @youtube Analysis; Reports; Forecasting; Benchmarks; Consolidation; and Alerts. Fathom plans depend on how
Price Range
   $     $     $     $     $   
   $     $     $     $     $   
Starting Price
$44/facility/month
Client OS
Web
Deployment
Cloud Hosted
Visual KPI Screenshot

Visual KPI

Visual KPI, by Transpara, provides a personalized dashboard you can use to monitor all of your information and add new visualizations. Create as many dashboards as you want, belonging to different profiles. The Visual KPI Dashboard is your personalized or role-based visualization of goal, objectives, metrics, and other object types (charts, groups, tables, embedded content, etc.). You and only you get to decide what goes on your dashboard and how it’s arranged. @youtube Web Client; Unlimited
Client OS
Windows, macOS, Linux, iOS, Android, Web
Deployment
Cloud or On-Premises
BrightGauge Screenshot

BrightGauge

BrightGauge software, a ConnectWise solution, offers real-time dashboards for monitoring your business operations. These Dashboards put all your important data in one place, so you can make faster, sharper decisions. Improve goal management and client reporting with this solution. @youtube Public dashboards and metrics; Calculated metrics; Datasource mashups; and Data storage with snapshots. BrightGauge has three payment plans available. The Standard plan is $259 per month. The Enterprise plan
Price Range
   $     $     $     $     $   
   $     $     $     $     $   
Starting Price
$259/month
Client OS
Web
Deployment
Cloud Hosted
Zoho CRM Screenshot

Zoho CRM

★★★★★
★★★★★
(3)
Zoho CRM is an online business management platform that caters to the needs of businesses of all types and sizes. The features allow you to track leads, nurture them along the sales funnel, and collaborate in real time and monitor business trends from a centralized hub.
Price Range
   $     $     $     $     $   
   $     $     $     $     $   
Starting Price
$14/user/month
Client OS
iOS, Android, Web
Deployment
Cloud Hosted
Domo Screenshot
Domo lets you connect your business to improve your decision-making. The software lets your integrate multiple data sources, store information, prepare reports, visualize your data, collaborate with other employees/departments, predict trends, and do more with your data via pre-built and custom apps. Domo provides solutions for the following industries: Education; Financial Services; Healthcare; High Tech; Hospitality; Manufacturing; Media and Entertainment; Professional Services; Retail and
Price Range
   $     $     $     $     $   
   $     $     $     $     $   
Starting Price
$83/month
Client OS
Web
Deployment
Cloud Hosted
ClicData Screenshot

ClicData

★★★★★
★★★★★
(8)
ClicData is the world’s first end-to-end business intelligence platform that allows you to turn data from any source into actionable metrics for your business users. Centralize your company data, KPIs and dashboards in one platform accessible from any browser and device. @youtube The features of ClicData include: ClicData offers native connectors to business applications (ERP, CRM, Marketing & Social Media, Web Analytics, Accounting & Invoicing, eCommerce…) and Databases (SQL, NoSQL, Data
Price Range
   $     $     $     $     $   
   $     $     $     $     $   
Starting Price
$71/month
Client OS
Web
Deployment
Cloud Hosted
Dundas BI Screenshot
Dundas BI is a dashboard, reporting, and analytics platform providing flexible business intelligence. Dundas BI lets all of your users collect data insights to better look into stats and data collected by your company. Dundas BI is used by both organizations and software vendors. Organizations can unlock data insights they need to make important business decisions. Software Vendors can use Dundas BI to give real-time data access directly in their program. @youtube The features of Dundas BI
Price Range
   $     $     $     $     $   
   $     $     $     $     $   
Starting Price
$6/user/month
Client OS
Windows, Web
Deployment
Cloud or On-Premises
Logi Analytics Screenshot

Logi Analytics

★★★★★
★★★★★
(1)
Logi Analytics helps your business build, deploy, enhance, maintain, and scale your application with the most intuitive, developer-grade embedded analytics available. Logi is dedicated to helping software teams embed cutting-edge analytics that engage end-users and create value. With Logi, you can match analytics to the rest of your branded application. The platform connects to: Relational databases: Oracle, MySQL, SQL Server, DB2, PostgreSQL, Progress OpenEdge; Big data: HP Vertica, Amazon
Client OS
Windows, macOS, iOS, Android, Web
Deployment
Cloud or On-Premises
Yellowfin BI Screenshot
Yellowfin BI is a powerful suite offering analytics that will let you share insights and make better decisions faster. Yellowfin drives to make businesses truly data-driven. Yellowfin BI has automated dashboards, insight dicovery for data analytics, AI-powered dashboards to help understand changes, data preperation, and a way to generate consistent organizational understanding. The full suite of Yellowfin will provide needs from beginning to end. Each of the Yellowfin products can be purchased
Client OS
Web
Deployment
Cloud Hosted
Tableau Screenshot

Tableau

★★★★★
★★★★★
(13)
Tableau is business intelligence software that allows anyone to connect to data in a few clicks, then visualize and create interactive, sharable dashboards with a few more. It’s easy enough that any Excel user can learn it, but powerful enough to satisfy even the most complex analytical problems. Securely sharing your findings with others only takes seconds. The result is BI software that you can trust to actually deliver answers to the people that need them. ::: alert UPDATE: On 6/10/2019,
Price Range
   $     $     $     $     $   
   $     $     $     $     $   
Starting Price
$70/user/month
Client OS
Windows, Web
Deployment
Cloud or On-Premises
Looker Screenshot
Looker is a business intelligence and big data software that harnesses the power of SQL to create powerful data analytics. Looker helps companies get value from their data and gives a 360 view of their customers. Looker provides a unified view of the organization so every department’s needs can be met and everyone an have a unified view. Looker can be set up quickly with pre-built applications, or at your own pace via custom work from a vendor. UPDATE: On 6/6/2019, Looker was acquired by Google.
Price Range
   $     $     $     $     $   
   $     $     $     $     $   
Starting Price
$300/user/month
Client OS
Windows
Deployment
Cloud Hosted
KPI Cloud Analytics Screenshot

KPI Cloud Analytics

A cloud-based reporting and analytics platform specifically built for organizations who use NetSuite. KPI Cloud Analytics for NetSuite helps enable companies to gain maximum return from NetSuite ERP information quickly and at a lower cost than with other solutions. Users of KPI Cloud Analytics gain access to dynamic reports and powerful visualizations that are key for companies to drive insightful decision making Retail department managers and executive teams can often spend countless hours in a
Client OS
Web
Deployment
Cloud Hosted
BSC Designer Screenshot

BSC Designer

★★★★★
★★★★★
(1)
BSC Designer is an agile tool for strategy design and execution. It approaches strategy on different levels - interactive strategy maps, KPIs, initiatives, reporting. The user journey starts with a free plan and 30+ templates for strategy scorecards included. The platform helps to organise team work by providing permissions on various levels. @youtube Interactive strategy maps; All-in-one tool for KPI calculation; and Support of different strategic planning frameworks. The cost of BSC Designer
Price Range
   $     $     $     $     $   
   $     $     $     $     $   
Starting Price
$69.95/user/month
Client OS
Windows, Web

We searched and searched, but we couldn’t find any products in our database that match your criteria. Perhaps our team of software experts can help? They’d be happy to provide a list of free the best KPI dashboard software recommendations that meet your exact requirements.

Sort by 
Filter by User Rating
Filter by Price Range
Filter by Deployment
Filter by Client OS
LinkedIn
Buyer’s Guide

What is KPI Software?

Key performance indicators, usually shortened to KPI, measure the success of your business. KPIs can be customized based on your specific industry needs. There is a wide range of potential KPIs, depending on exactly what company goals you want to measure.

KPI software automates the measurement of different processes in order to provide a comprehensive overview of business tasks. Operating as a subset of business intelligence systems, KPIs track everything from company goals to individual employee performance to reach your main objectives.

Some popular KPIs include:

  • Conversion rates
  • Net sales
  • Engagement metrics
  • Call duration

With KPI software, you can start measuring and monitoring all of these specific indicators and much more. Finding KPIs for your industry often follows the SMART acronym:

  • Specific purpose: Answers the who, what, where, why and which to make the goals specific.
  • Measurable: What are the concrete criteria for measuring progress toward the goal?
  • Attainable: How is the goal attainable?
  • Relevant: How do the goals relate to your team, department, and organization?
  • Time: What is the time frame for reaching the goals?

Once you’ve selected your performance indicators, you can set automated alerts to notify you when goals are met or missed. Visual reports and sorting/filtering capabilities keep managers updated as to the progress of those goals. And real-time tracking from customizable dashboards let you review changes to your company metrics.

SimpleKPI Dashboard
Build a custom KPI dashboard with SimpleKPI.

Features of KPI Software

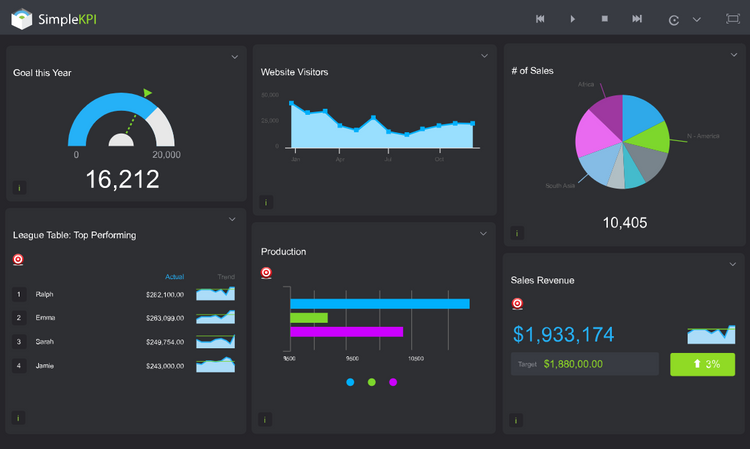
  • Custom KPI dashboard: Design customized dashboards to visualize select KPIs
  • Automated alerts and notifications: Send out alerts when KPIs are at risk of falling behind; automate notifications to inform management when goals are completed
  • Data integration: Pull data from various sources into one dashboard or on reports
  • Analytics and reporting: Analyze internal KPI data against predetermined goals; submit data into report format for review by your business in order to identify areas of improvement
  • Trend tracking: Follow emerging trends for your industry by collecting data for select KPIs
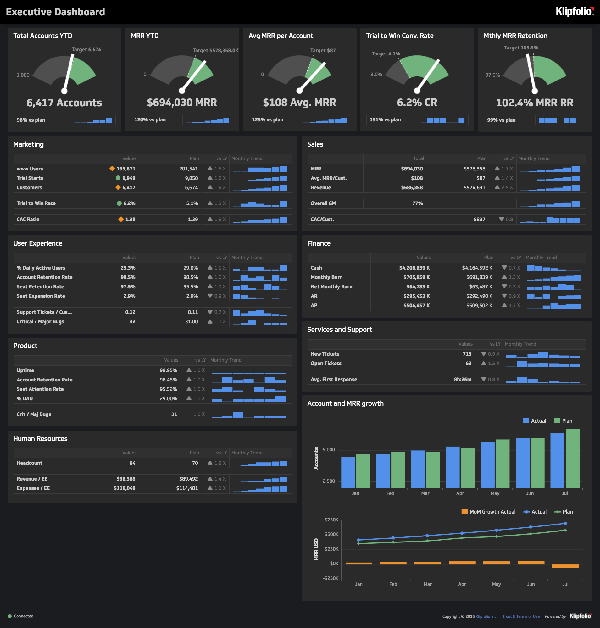
Klipfolio Dashboard
Klipfolio creates strategic dashboards to showcase different KPIs.

Best KPI Software Benefits

Introducing a KPI software into your business processes can provide you with a lot of benefits, including:

Measure Custom KPIs

Every industry has different standards for success and failure. With KPI software, you can select your own key performance indicators based on what measurements will most accurately reflect your objectives. Then track how those KPIs change over time by using KPI reporting software to collect relevant data from set time periods.

For example, KPI software can measure how many website visits end in successful conversions, whether it’s submitted contact forms or inquiring phone calls to your company. You can monitor how those metrics change on a daily, weekly or monthly basis. Compare different quarterly numbers to see if seasonal factors are impacting sales. Or learn which days of the week have the most successful conversions.

Further, you can use KPI software to track individual performance metrics for employees, teams, and departments. Analyze specific success rates for call conversions by your sales team, or calculate which products have the best ROI on your eCommerce website. There are plenty of ways to measure who and what is working best for your business. Additionally, these individual metrics are useful when it’s time to perform employee evaluations or determine annual commission bonuses.

Sisense
This Sisense KPI dashboard was designed to measure call center metrics.

Easily Visualize KPIs

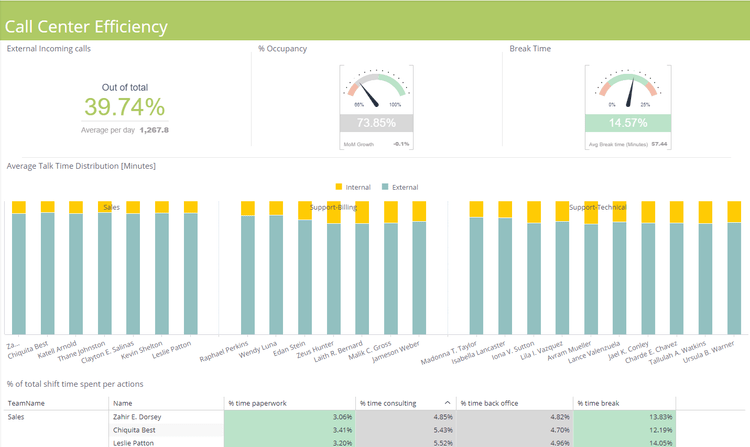
Having an overview of your metrics can provide an easy to understand view of your business performance. KPI dashboards show highly visualized representations of select data points related to your preset goals and objectives.

Dashboards full of business data can be organized based on your preferences. Make templates to set up custom:

  • Bar charts
  • Line graphs
  • Pie charts
  • Scoreboards or scorecards

Once you’ve set your preferred style, you can share each metric with others within your organization. Each department can have their own style which KPI software can modify when sharing so everyone is on the same page. From team leaders to upper management, a customizable dashboard allows everyone to understand complex data related to your business goals at a glance.

Further, KPI software which is cloud-based may include custom apps for accessing data visualization from mobile devices. You can monitor potential changes to your key performance indicators in real-time from anywhere you want.

Analyzing KPI has been part of doing business for decades. However, the methodology has greatly changed, particularly in recent years, thanks to software development. As such, it’s become easier than ever to identify growing trends within your company or industry as a whole. This can lead to adjustments in how you perform business decision-making.

KPI software tracks the metrics you select based on what you think shows success. Sometimes, you might realize you’re tracking the wrong metrics for demonstrating success. For instance, maybe you’re measuring success by total sales of a certain product when you really should be paying attention to how many units are sold per transaction or total revenue. What data source is right for one business can be wrong for another. KPI software helps you find the best metrics to track for long-term success regarding your company’s strategic goals.

KPI Software Pricing

KPI software pricing depends on a few factors, mostly whether you want an on-premise solution or a cloud-hosted solution. SaaS lets you access services from anywhere in the world, making it popular with companies with multiple locations. However, on-prem solutions are popular with smaller businesses or those which need on-location security measures to protect data.

Monthly payment plans for KPI software starts at $6 and goes all the way up to $259. Several solutions offer discounts for making annual payments instead of monthly ones. There are also many free trials to test out the software for your business.