The Best SPC Software
We picked the top SPC software for manufacturers needing real-time quality control and process visibility. These tools fit a range of needs, whether you’re in automotive, aerospace, or medical device production.

- Streamlines manufacturing operations
- Real-time visibility into the manufacturing process
- Integration with other systems for improved efficiency and productivity
- Several different control charts
- Customizable mobile app
- SAP Digital Manufacturing integration

- Real-time shop floor application
- Has customizable features
Statistical process control or SPC software helps manufacturers monitor quality control data and analyze key process information. Using our advanced review methodology, we’ve ranked our best picks based on data analysis, reporting, and compliance.
- DELMIAWorks: Best Overall
- Minitab SPC: Best for Automotive Manufacturers
- DataLyzer Qualis: Best for Highly-Regulated Environments
- SPC for Excel: Best for Microsoft Users
- Advantive SPC: Best Multi-Site Support
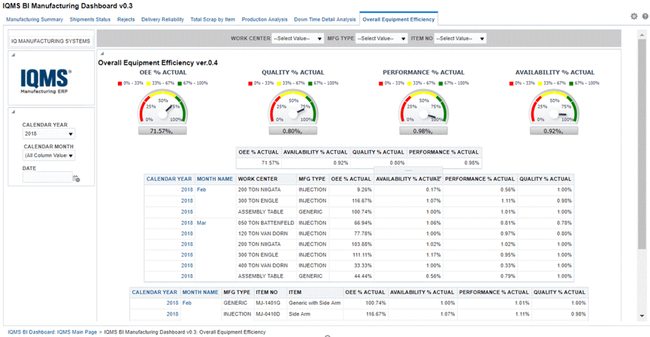
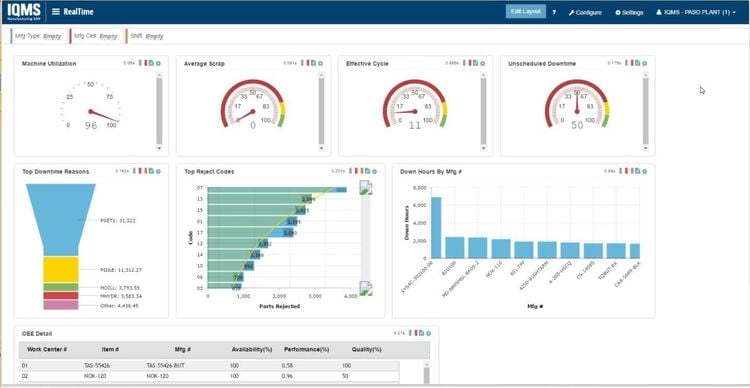
DELMIAWorks - Best Overall
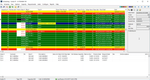
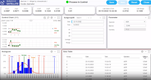
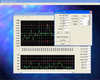
DELMIAWorks’s RealTime Process Monitoring System acts as a live data collection engine, pulling continuous input from machine sensors and factory floor controllers. It captures high-frequency process parameters like injection pressure, cooling cycle times, and defect rates. From there, DELMIAWork’s SPC tools layer on top of RealTime data:
- Dynamic Control Charts: Highlight process drift or out-of-spec conditions; supports X-bar, R, S, p, np, c, and u charts
- Correlation and Cause Analysis: Helps identify root causes of scrap; includes drag-and-drop interface to correlate variables
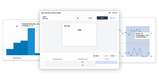
- Histograms & Pareto Charts: Provide frequency distribution and defect cause analysis
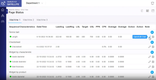
- SPC Drill-Down Reporting: View SPC data by job number, part number, shift, machine, or operator
DELMIAWorks’ SPC tools help you catch out-of-control conditions in real time and prevent defective runs later. This SPC software also provides traceable process data for FDA-regulated or ISO-certified environments. It’s a solid fit for manufacturers with $10 to $20 million in revenue who have the technical know-how to install machine-level sensors, especially on legacy or customized equipment.

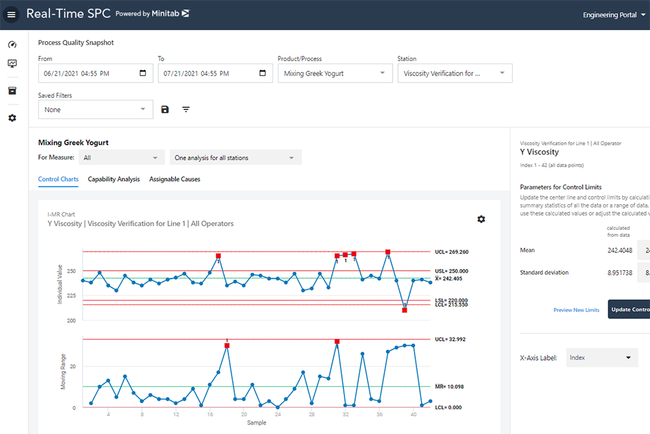
Minitab SPC - Best for Automotive Manufacturers
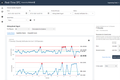
Minitab’s Real-Time SPC system delivers strong monitoring and charting capabilities for automotive manufacturers. It offers control charts and dashboards for process monitoring, including Xbar-R, EWMA (Exponentially Weighted Moving Average), and I-MR-R/S. Its advanced control EWMA chart can detect even the smallest process shifts, ideal for auto manufacturers that require precision and tight part specifications.
Its native mobile app allows engineers and manufacturers to look into quality issues from anywhere. The app can automatically send alerts, feedback, and warnings directly to email or text so everyone can stay on top of potential problems that arise. The system is partnered with SAP Digital Manufacturing to allow easy integration with a popular MES. One drawback of Minitab is that it does not have public pricing available.
DataLyzer Qualis - Best for Highly-Regulated Environments
DataLyzer Qualis is adaptable to various industry standards, including FDA CFR 21 Part 11, IATF 16949, and AS13006. This flexibility ensures it can meet the regulatory and quality control requirements of several manufacturing sectors, including automotive and medical parts. DataLyzer also offers integrated OEE, CAPA, FMEA, and MSA for further processing analysis.
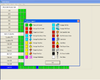
Its customizable shop floor screens allow operators to tailor them to their specific needs and create personalized workflows for different data entries. The software supports more than 20 languages, so users can better access locally-based partners worldwide. However, some users have reported trouble saving individual part parameters, which could create tedious data re-entry.


SPC for Excel - Best for Microsoft Users
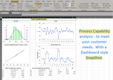
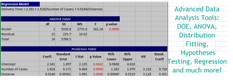
SPC for Excel integrates directly with Microsoft Excel, making it accessible and familiar to many users. The software includes many statistical tools, including Pareto charts, control charts, process capability analysis, and Gage R&R analysis. And because it exists in Excel, your team doesn’t have to learn a whole new workflow.
Additionally, the software helps minimize the risk involved with manually performing SPC. Often, formulas are copied incorrectly, or rigid templates lead to inconsistencies in results. With SPC for Excel, it standardizes your methods across users. This allows for simple formula updates as data changes, and lets your team produce consistent, repeatable results.
This SPC software helps users with onboarding by providing training resources like getting-started guides and how-to videos, catering to beginners and advanced users. The system starts at $329 for a perpetual license for one user, with discounted prices as the user count increases. This makes the system more affordable than other platforms, making it a good option for smaller manufacturers. However, one downside is that it is only on-premise deployment.
Advantive SPC - Best Multi-Site Support
Advantive SPC (formerly InfinityQS) analyzes several data points, including multiple sites, production lines, and product codes. The granular-level reporting capabilities help manufacturers reduce waste, enhance product quality, and maintain industry compliance.
Additionally, Advantive provides streamlined data collection, housing all collected information in a single data repository for easy analysis. Its control charts deliver real-time insights into any process changes requiring investigation, helping the shop floor stay aware of potential issues. The SPC system easily integrates with other Advantive software, such as its ERP and MES solutions, for complete data control.

What is SPC Software?
Statistical process control software applies statistical process control (SPC) to live production data. SPC is a quality method that uses sampled measurements and statistical limits to detect variation in processes such as part dimensions, fill weights, and cycle times during production. Manufacturers use SPC software to identify product quality issues and process variations, take corrective action before extensive issues occur, and improve process performance.
SPC software monitors product quality control data and the performance of machines and other manufacturing tools. It notifies shop floor personnel when product quality or machine performance exceeds the acceptable range. This allows manufacturers to reduce rework, improve efficiency, and increase their bottom line.
The data collected by SPC software is plotted onto user-friendly graphs. Having the data in an easy-to-read format lets you see when data variations occur and how far they deviate from the expected value.
Primary Benefits
Automatic Notifications
Real-time statistical process control solutions assist with data collection and analysis. When data points fall above or below the expected parameters, the system automatically notifies you as soon as the anomaly occurs. These data points could include temperature ranges, product dimensions, and machining time.
Catching issues as soon as they occur will help you reduce waste and overall production costs. You won’t have to scrap an entire product or production run due to an error that wasn’t caught until after the fact.
Reduced Waste and Rework Time
The data analysis tools in real-time SPC software allow you to make quality improvements to manufacturing processes and products during production. This decreases the amount of wasted material and time spent completely reworking or throwing out defective products. Having reliable quality control data from SPC software will also prevent you from shipping defective products to customers.
Documentation for Customers and Auditors
Supplying products and materials for automotive, aerospace, or medical device customers means proving process capability rather than asserting it. Because SPC software stores every measurement with a timestamp and the operator who recorded it, producing a capability report or an audit trail is as simple as a search or query, rather than days of spreadsheet reconstruction.
The value compounds for manufacturers that manage many active part numbers, since capability submissions recur with every design change or tooling replacement. Pulling those figures from a system that already holds the history turns a routine customer request into a routine task.
Types of SPC Charts
SPC charts give manufacturers a better handle on data management. The raw SPC data is formatted into charts showing product or process quality variations. Some of these charts include:
Control Charts
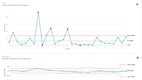
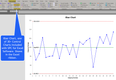
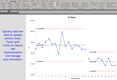
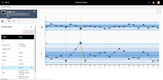
Control charts are important SPC tools that plot changes in process data over a period of time. These charts typically feature three horizontal lines demonstrating the upper, lower, and average control limit. When data falls outside the control limit range, your team will be notified to take corrective action immediately. You will be prompted to analyze the root cause to determine why the data outliers occurred. This helps you make more informed decisions when taking corrective action.
Control charts within SPC software can be customized to monitor processes relevant to your business, such as temperature ranges or machining time.
There are a few different types of control charts that can be created within SPC software, including:
- X-Bar and Range “R” Charts: Data collected at regular intervals from a small, constant sample size (typically under 10) to determine the minimum and maximum ranges between a set of data points.
- X-Bar and Standard Deviation “S” Charts: Data collected from larger samples to determine variations using all data collected (not just the min and max ranges).
- Individual-X and Moving Range Chart (IX-MR): Data is collected from a single sample size to show individual measurements and absolute differences between values. These charts are typically used when sampling is time-consuming or expensive.

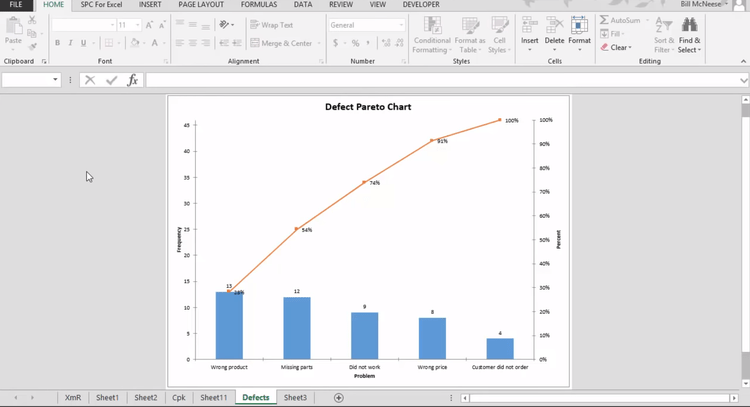
Pareto Charts
SPC software compiles and plots data into a Pareto chart. Pareto charts provide a bar chart of issues or causes of problems and prioritize the issues in order of frequency. This data can include:
- Defect types
- Customer complaints
- Reasons for machine downtime
- Reasons for late deliveries
- Injuries on the job
Knowing where issues are coming from and their frequency helps you prioritize and take corrective action.
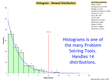
Histograms
Histograms in SPC software are bar charts that show data distribution over time. For example, the SPC software will compile data on bottle diameters for a production run over a specified period of time. The diameter measurements are plotted onto a histogram that allows you to see how many bottles had diameters that were too big or too small.
The shape of the histogram allows you to determine whether the process variations were stable or unstable. Histogram charts are often used in conjunction with control charts to visualize the data distribution more clearly.

SPC vs. QMS
Statistical process control and quality management overlap enough that buyers regularly shop for one when they need the other.
- SPC software monitors individual process measurements while production runs.
- A quality management system (QMS) manages the workflows and records that prove your quality program works.
A QMS handles document control, audit records, training sign-offs, supplier qualification, and nonconformance routing. What most QMS platforms don’t do is plot live control charts, calculate capability indices, or alert an operator mid-run that a process is trending toward a specification limit. SPC software does those things and generally not much else. It won’t store your standard operating procedures or track who completed which training.
If you’re choosing between them, look at what’s costing you the most money right now. An increase in scrap and rework points toward SPC. Failed audits, missing records, and corrective actions that sit open for months point to a QMS. Manufacturers who need both usually buy the more urgent one first and integrate later.
What Type of SPC Software Do You Need?
SPC software can be a standalone solution for companies looking to integrate statistical process control into their current system or as part of a complete ERP solution. Some SPC software packages are geared towards manufacturers with industry-specific quality compliance requirements.
Standalone SPC Software
Standalone SPC software is a great option for manufacturers with straightforward production processes that want to focus on quality or process improvement. These solutions are often easily integrated with other existing systems like quality management systems, CMMS, or MES systems for more in-depth supply chain management, waste tracking, traceability, work-in-progress tracking, and more.
Real-time data collected from quality systems and other software products can then be automatically plotted onto easy-to-read charts and graphs. Some solutions work with Microsoft Excel to import and graph the SPC data in a familiar environment.
Shop Floor Systems With SPC
Manufacturers already investing in shop floor execution can often get SPC as part of that purchase. Manufacturing execution systems bundle it with scheduling, work order tracking, and traceability, putting quality data in the same system as production data rather than in a completely separate database. OEE software draws on the same machine data to score equipment performance, so a plant already tracking downtime may have most of the data collection layer SPC needs in place.
The depth of SPC support in shop floor systems varies more than marketing suggests. Before assuming a module is enough, check whether it calculates capability indices and lets you configure control rules beyond a simple limit breach.
Industry-Specific SPC Software
Certain manufacturing industries need an industry-specific SPC to ensure their products and processes comply with regulations. For example, the FDA regulates medical device manufacturers to meet certain quality standards to ensure they are safe and effective for patient use. Quality Management System Regulation (QMSR) (formerly 21 CFR 820:100) dictates that corrective and preventative action (CAPA) processes must be in place. SPC software helps medical device manufacturers track the right quality data and enact CAPA.
ERP Software with SPC Capability
Large manufacturers that want an all-in-one solution to handle a variety of processes like accounting, customer relationship management, budgeting, and statistical process control can look for a complete ERP system. ERP software that is geared toward the manufacturing industry can have an SPC module that provides comprehensive statistical tools for data analysis and continuous improvement.
How to Choose an SPC System
Finding the right SPC software for your business is no easy task. We crafted these 8 questions to help you narrow options before you sit through demos:
-
Know what’s forcing the decision: Many SPC purchases happen because a customer requires process data, not because the shop set out to reduce scrap. If a customer requires the data, get their specification in hand first, since it names the capability figures, sample sizes, and submission formats you have to produce. If you’re doing this to cut scrap, define your own targets before you shop: which processes are losing material, what the scrap rate is now, and what the measurements are that tell you it’s improving.
-
Count your parts and characteristics: This predicts your needs better than company size does. A few dimensions across a handful of part numbers stays manageable in Excel, and plenty of quality engineers run it that way for years. Once you’re tracking dozens of part numbers with several characteristics each, you need structured data collection. Ask how long part setup takes, since building that library is usually the bulk of the implementation.
-
Match data collection to the equipment you already own: Most systems accept manual entry, but the payoff comes from pulling measurements straight off hand gages, CMMS, and machine controllers. Verify which gage brands the system reads and what adding others later costs. SPC packages sold by metrology manufacturers tend to favor their own hardware, so a mixed tool crib points toward a device-agnostic system.
-
Confirm it handles attribute data, not just measurements: Every SPC tool charts variable data like dimensions and weights. If inspectors also record pass/fail results or defect counts, you need attribute charts (p, np, c, and u) and an entry path built for counting rather than measuring. Shops running visual inspection alongside dimensional measurement get caught here most often.
-
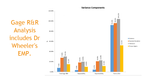
Check the analysis output against your customer’s thresholds: Control charts alone won’t satisfy an automotive or aerospace customer. Confirm the system calculates capability indices (Cp, Cpk, Pp, Ppk) and supports Gage R&R studies, since AIAG expects a minimum Cpk of 1.67 on new processes at part approval. Ask how it flags an out-of-control condition, too. Detecting only a control limit breach misses the trend and run patterns that warn you earlier.
-
Map your compliance obligations before you shortlist: SPC is one of the AIAG core tools required under IATF 16949, aerospace suppliers meet similar expectations through AS9145, and medical device manufacturers need records that satisfy FDA quality system requirements. All of those need an audit trail showing who recorded a measurement and who changed a control limit. Part approval also recurs, since design changes, tooling replacement, and new material sources each trigger a resubmission.
-
Decide who’s using it every day: Operator-facing and engineer-facing systems are different products. General statistical packages, for example, serve engineers well but can overwhelm a shop-floor employee. Screens built for the floor need to be fast, hard to enter incorrect data, and readable at a workstation. A quality engineer, on the other hand, would likely need flexible analysis and reporting with drill-down capability.
-
Price the whole thing, not the license: Ask what happens when a maintenance agreement lapses, since some systems stop working entirely and others keep running in a limited state. Ask whether custom reports survive version upgrades. Then weigh a preferred deployment method. A cloud-based system simplifies multi-site rollout and cross-plant comparison, while an on-premise system gives more control where connectivity is poor. If you run multiple plants, confirm the vendor supports your regions.
SPC Software Pricing
SPC software pricing depends more on the number of places you collect data than on the number of people using the software. Below is a breakdown of costs based on production complexity:
One or Two Stations (Manual Entry)
$300 to $1,500 per user or per station
- Excel add-ins and single-seat desktop tools handle charting, capability analysis, and Gage R&R studies. Operators type measurements in by hand, so there’s no shared database and no audit trail showing who recorded what.
One or Two Stations (Automated Collection)
$1,500 to $2,500 per seat, or roughly $50 to $100 per user monthly
- Gage connections replace manual entry, and a multi-user database lets several people work from the same measurements. Out-of-control alerting comes standard at this level. Most single-plant shops that have outgrown spreadsheets land here.
A Full Plant, Multiple Lines
$20,000+, quote-based
- Pricing follows line count, station count, and integration complexity rather than a per-seat list. Two shops with identical headcounts can get quotes that differ substantially.
Multiple Locations
Quote only
- Cost tracks how many sites you’re covering and how much custom work your existing systems require. What you’re buying at this level is cross-plant capability comparison and centralized administration.
Other Costs to Consider
- Gage interface hardware: Connecting hand gages to a PC requires cables, interface boxes, or wireless modules, bought per station and separately from the software.
- Part and characteristic setup: Configuring your part library is usually the largest line item after licensing, whether you pay the vendor to do it or absorb the internal hours.
- Modules: Some vendors sell capability analysis, gage management, and reporting separately, so confirm what the base license includes before comparing prices.
- Licensing model: Concurrent licensing is common in this category and counts simultaneous users rather than named ones, which costs less for shift-based operations than a per-seat count implies.
- Annual maintenance: Ask what happens if it lapses. Some systems stop working entirely, others keep running without updates or support.
- Training: Software won’t teach anyone to read a control chart. If SPC is new to your team, budget for training separately from implementation.