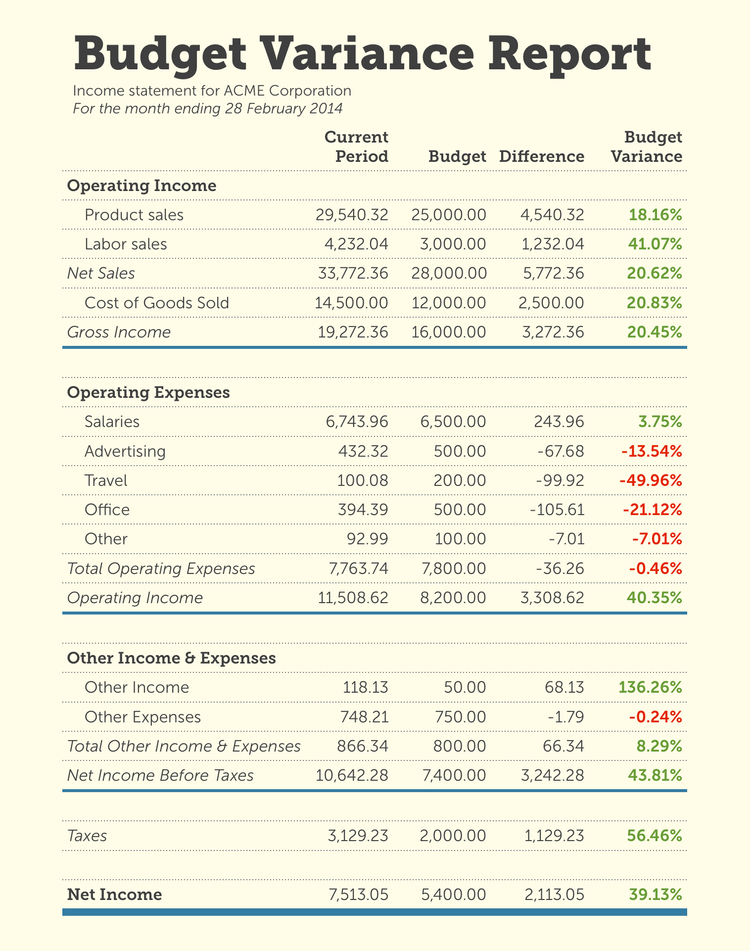
What Are Variance Reports?
A variance report is a planning document that compares budgeted amounts for expenses and revenue to actual results. This type of reporting can also show deviations between budgeted and forecasted results.
Conducting variance analysis can help your company take corrective measures when budgeting. Read on to discover why variance reporting is essential, what its common types are, and how to prepare.
Why Is Variance Reporting Important?
Variance reporting can benefit your business by:
Facilitating better budgetary control: It allows you to compare planned costs with actual spending and helps you identify where you exceeded your budget. Improves performance: It helps determine whether targets are being met and allows you to identify trends over time. ** Enhances financial analysis:** It can detect accounting errors and potential fraud and examine the causes behind discrepancies. Improves future planning: After identifying where you overspent versus underspent, you can better allocate your resources and create a more accurate budget.
Types of Variances
Direct Labor Variance
Direct labor variance describes a scenario where the actual labor cost differs from the expected or standard rate. It can also refer to labor efficiency variance, where the number of units produced in a standard hour of labor differs from actual performance.
This variance can help you understand how effectively you’re utilizing labor resources and can help you see inefficiencies or changes in labor rates.
Direct Material Variance
Direct material variance is the difference between the standard cost of materials expected for production versus the actual costs incurred.
One example of this type of deviation includes purchase price variance, where the expected cost of raw materials differs from the actual price. A second example includes material yield variance, where a discrepancy emerges between the expected and actual quantity of materials required for a standard number of units produced.
Overhead Spending Variance
Discrepancies in overhead costs could stem from changes in fixed and variable overhead expenses. Fixed overhead costs can include recurring expenses, like mortgage payments and property taxes. Variable overhead costs include emergency equipment repairs, energy expenses, or raw material costs.
Sales Variance
Sales deviations include sales price variance and sales volume variance, where a company makes sales at a price or volume either lower or higher than expected. Analyzing these differences helps businesses evaluate market conditions and optimize business decisions.
How to Prepare
Before you begin, you’ll need financial statements like your budget, income statement, or balance sheet to source budgeted and actual numbers.
Next, place the revenue and expense line items into separate sections. For example, your revenue section might include cost of goods sold (COGS), gross income, and net sales. The expenses section might consist of total operating expenses and operating income.
Prepare your variance report using four steps:
Insert your actual revenue and expenses into your first column. Add your budgeted revenue and expenses into the next column. Calculate the difference between your budgeted and actual numbers. List differences in the next column. Calculate the percentage difference using this formula: (actual results / budgeted results) -1 x 100. List percentages in your final column.

Calculate Variance Percentages and Dollar Amounts
In the budget variance report above, ACME Corporation budgeted $6,500 for salary expenses, but the actual cost totaled $6,743.96. To calculate the dollar amount, you would subtract the budgeted amount from the actual cost:
$6,743.96 - $6,500 = $243.96
You would then calculate the variance percentage with the following formula:
(Actual results / budgeted results) -1 x 100
($6,743.96 / $6,500 ) -1 x 100 = 3.75%
In this case, you’re 3.75% over budget for salary expenses, an example of negative variance.
Positive vs. Negative Variances
Also known as favorable variance, positive variances occur when actual revenue is higher than forecasted, and expenses are lower than forecasted. Positive variances also indicate lower manufacturing costs or operating expenses than the budgeted amount.
Negative variances indicate a budget shortfall, where costs are higher than initially forecasted or revenue is lower than expected.
FAQs
What is the difference between predetermined and ad hoc variance reports?
Predetermined variance reports show deviations between budgeted income and expenses and actual amounts. Companies run these reports monthly, quarterly, or yearly.
Ad hoc variance reports analyze anomalies in numbers as needed, showing deviations in real-time. Accountants might run these in emergencies or on a daily, weekly, or monthly schedule.
How do I reduce budget variances?
Businesses can reduce unfavorable variances by taking the following steps:
-
Identify where the discrepancy originated. Through variance reporting and analysis, your company can determine where the deviation occurred – for example, in the direct materials cost line item under operating expenses.
-
Determine when the discrepancy occurred. For example, timing variances might occur due to late invoices or early payments. Generally, the next financial period will reverse this temporary variance.
-
Investigate why the discrepancy occurred. In the direct materials variance example, determine the cause for the pricing change: has the standard purchase price fluctuated? Are the raw materials yielding fewer units than anticipated?
-
Take corrective measures to prevent future discrepancies. This could mean finding cheaper alternatives to raw materials used in production or shifting your budget to reflect new standards in direct labor costs.
Is there a way to automate variance reporting?
You can improve your business finances with accounting software. In addition to automating variance reporting, a basic accounting system can help improve revenue and expense tracking with accounts payable, accounts receivable, and general ledger modules.
