How to Calculate OEE
Overall equipment effectiveness (OEE) is the process of grabbing measurements of machine availability, throughput, and quality and turning them into a score that grades your manufacturing performance. This means OEE is a measure of manufacturing productivity.
OEE is a combination of the three measurements:
- Availability: How much product can be produced in a set time period?
- Performance (Throughput): How quick is production?
- Quality: Are products being manufactured to the specifications?
OEE Calculation
How does OEE become calculated? The simple calculation of OEE is as follows:
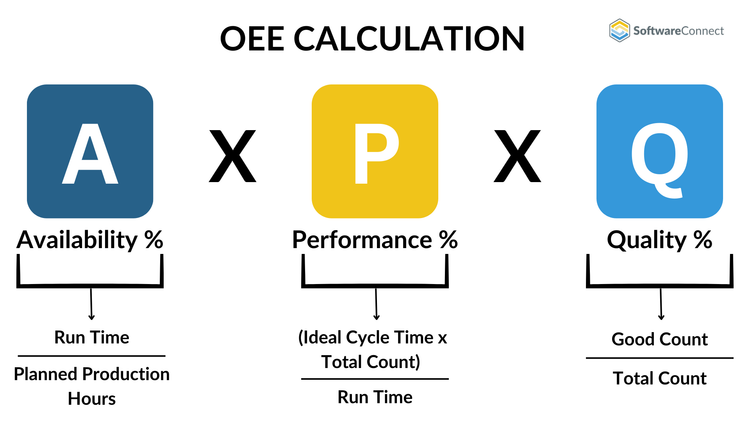
Availability × Performance × Quality = OEE
An OEE score is considered a key performance indicator (KPI), which can be configured with alarms and analyzed to ensure maximum production on your manufacturing shop floor. Often, the score is calculated using OEE software.
But what are the determinants of availability, performance, and quality? Finding the OEE starts with measuring the availability, which is calculated by dividing the total run time by the total planned production time. Next, you measure performance, which divides the throughput by its maximum possible throughput. Finally, the quality figures are determined by dividing the number of usable assets produced by the total assets that have started production.
Let us break that down further by looking at each individual measurement.
Availability
Availability is calculated as the ratio of run time to planned production time. This takes into account availability loss, which includes events that stopped planned production, unplanned stops, and planned stops.
Run Time ÷ Planned Production Time = Availability
Run Time can be calculated by taking Planned Production Time and subtracting total machine downtime. This means Availability can also be written as:
(Planned Production Time - Downtime) ÷ Planned Production Time = Availability
Note that scheduled breaks, planned maintenance, and safety meetings are not considered downtime since they are scheduled beforehand. Only unexpected stoppages are considered downtime when calculating OEE.
How is this put into practice? Let us use the example of an 8-hour shift, where a workplace provides two 15-minute breaks on top of a 30-minute lunch break (for a total of 1 hour of breaks). Because these are planned downtime events, they don’t hurt your availability—you just remove an hour from your planned production time.
(8 hours - 1 hour of breaks) = 7 hours
i.e. you only actually have 7 hours of planned production
Now, say there is 30 minutes of downtime due to an emergency stop that was unplanned. You subtract these 30 minutes from the 7 hours of planned production time, then divide the difference by the planned production time to get total availability.
(7 hours - 0.5 hours) ÷ 7 hours
i.e. 6.5 ÷ 7 = 92.86% availability
Performance
Performance is calculated as the ratio of your actual output to your theoretical output. It basically compares how fast the equipment ran compared to its ideal running speed.
Actual Output ÷ (Run Time x Standard Rate) = Performance
(Run time x Standard Rate is your Theoretical Output)
Standard rate can be considered the fastest possible time to manufacture one product. When multiplied by the total count, the result is the theoretical output, the fastest possible time to manufacture the total quantity of pieces.
How is this put into practice? Let us say that 60 parts can be produced per hour. From the availability calculations, we know our actual run time is 6.5 hours for the day. Therefore, our theoretical output is 6.5 hours times 60 parts an hour, or 390 parts. This number represents the total number of parts that should be produced during our run time.
For this example, let’s pretend that only 350 parts were produced during the workday (this is the total parts, including bad ones). This number represents our actual output. With this figure, we can now determine our performance:
350 parts produced ÷ (6.5 hours × 60 parts an hour ) = 350 ÷ 390 or 89.74% performance
Quality
Quality is calculated as Good Count divided by Total Count. This is because some manufactured parts won’t meet your internal or external quality standards. Therefore, to calculate Quality, you take the Good Count (parts that pass through the manufacturing process the first time without rework) and divide that by the total count.
Quality: Good Count ÷ Total Count
Quality takes into account Quality Loss. This can also include pieces that will reenter the manufacturing process for rework. This calculation ignores stop time and simply looks at the Good Count, which is manufactured as fast as possible.
From our previous example, we know that 350 parts were produced. This is the Total Count. For this example, we can say that 30 of those parts needed rework or were completely scrapped. If you subtract 30 parts from 350 parts, you end up with 320 parts–the Good Count.
320 parts ÷ 350 parts = 91.43% Quality
Overall Equipment Effectiveness (OEE)
The preferred OEE calculation is as it was mentioned above, or multiplying the three OEE factors together:
Availability × Performance × Quality = OEE
Now that we understand how these factors are determined, we can fully understand how to calculate OEE. If the equations for Availability, Performance, and Quality are substituted into the main OEE equation, we can also illustrate the equation as
(Run Time ÷ Planned Production Time) × ((Ideal Cycle Time × Total Count) ÷ Run Time) × (Good Count ÷ Total Count) = OEE
If we grab the numbers from the above examples and plug them into the simple OEE equation, we can find the OEE for our imaginary scenario.
OEE = 92.86% × 89.74% × 91.43% = 76.19%
Benchmarks
What is considered a good OEE score?
- An OEE score of 100% is perfect production. This means you’re manufacturing high-quality parts at the fastest possible rate, with no stoppage. This is theoretically possible, but not a realistic or sustainable goal in practice.
- An OEE score of 85% is considered an incredible benchmark to hit, and for most companies will be a suitable long-term goal.
- An OEE score of 60% is average and usually means room for improvement.
- An OEE score of 40% or below is considered low. This does not mean it’s uncommon–but it does mean you may be a newer business working out the kinks or that your processes can be easily improved through some simple changes.
Examples of Loss
OEE is the ratio of fully productive time to planned production time, and takes six big losses into account, with two types of losses coming from each measurement:
- Availability Loss: Setup and adjustments, breakdowns
- Performance Loss: Reduced speed, small stops in work
- Quality Loss: Production rejects, startup rejects
OEE Software
OEE software will automatically grab the required measurements and turn them into a score that grades the manufacturing performance. This data can be acquired in real time and takes into account forecasting to know where you stand for the day and where you are projected to finish if your rate continues at the same pace, output, and quality of production. Examples of data captured include downtime, counters, design speeds, and contextual data.
OEE software works very closely with MES software in a manufacturing environment. This is because MES applications allow decision-makers to use OEE to their advantage through reports, Pareto charts, and a corporate overview of performance. Those with more manual processes (and thus, no MES system in place) may want to consider OLE (overall labor effectiveness), which helps measure how effective your workforce is through their productivity levels (such as how much they are producing per day).
A business can benefit from OEE software through reduced downtime and rate losses, improved operational cost control, and improved manufacturing performance. This type of software also works closely with statistical process control (SPC) software, which is in charge of collecting quality and performance data in real time for statistical analysis. While data from OEE systems give insight into your manufacturing performance (and thus help reduce costs by ensuring you get the most out of your employees, equipment, and facilities), SPC data helps identify quality issues and process variations. This allows for corrective action to take place before issues occur.
Total Effective Equipment Performance (TEEP) vs. OEE
Closely related to OEE, total effective equipment performance (TEEP) considers calendar hours instead of scheduled operating hours. In other words, it takes into account utilization. Measuring utilization is important to know the true capacity of your manufacturing operation, as it takes into account schedule losses.
The biggest difference between OEE and TEEP is that OEE measures planned production time while TEEP measures all truly productive time. OEE is useful in determining how productive a manufacturing operation is while it’s running during scheduled working hours. TEEP factors in the impact of scheduled downtime or hours when the manufacturing plant is closed. TEEP aims to show how much additional capacity is available to increase production without new equipment expenses.
TEEP Calculation
TEEP is a simple extension of OEE, and it is calculated by multiplying the three measurements from OEE and utilization. It looks like this:
Availability × Performance × Quality × Utilization = TEEP
This could also be written as follows:
OEE × Utilization = TEEP
Since TEEP takes into account schedule losses (such as the plant not being open or times that production is not scheduled), it can be known as the ratio of fully productive time to all time. In other words, TEEP helps show the untapped potential of your manufacturing operations.
One example is a manufacturing plant with an OEE score of 75%. While this may be seen as a great score, the TEEP will usually be much lower. If a factory is only open for 16 hours a day (out of 24) and only 5 days a week (out of 7), that means they are in production time 80 hours a week. However, there are 168 hours in a given week. By dividing 80 hours by 168 hours, you get your utilization rate (47.62%). And finally, calculating the OEE score of 75% times the utilization rate of 47.62% gives you:
TEEP = 0.75 × .4762 = 0.35715 = 37.715%
It’s important to put a TEEP score into perspective, as a perfect TEEP score (100%) means you are making parts as fast as possible with no stops around the clock (24/7), which implies no schedule losses and no OEE losses. This kind of production seems impractical for any business to implement. TEEP should be used for perspective, helping you better understand your sales and capacity, labor and utilization, and manufacturing performance.