The Best Reporting Tools

Get the best software for your business. Compare product reviews, pricing below.

Talk with a software advisor
Talk with an advisor
Get a free consultation from an independent expert.
Or, call toll-free: (800) 827-1151
Talk with a software advisor
Talk with an advisor

Popular Products

No products found
Tableau Screenshot

Tableau

★★★★★
★★★★★
(13)
Tableau is a business intelligence and data visualization tool. It excels in creating easy-to-understand visualizations from complex data, facilitating informed decision-making. Tableau’s user-friendly interface, with drag-and-drop capabilities, allows users with varying technical expertise to create dynamic, interactive reports and dashboards, enhancing data exploration and collaboration​
Price Range
   $     $     $     $     $   
   $     $     $     $     $   
Starting Price
$75/user/month
Client OS
Windows, Web
Deployment
Cloud or On-Premises
Sisense Screenshot
Sisense, formerly Periscope Data, is a business intelligence tool offering data management and visualization capabilities. It provides ease of setup, connecting seamlessly to a wide variety of data formats and platforms. The software enables fast data alterations and updates, and its analytics platform, Sisense Fusion, uses AI and machine learning for data analysis.
Price Range
   $     $     $     $     $   
   $     $     $     $     $   
Starting Price
$4,200/user (perpetual license)
Client OS
Windows, Web
Deployment
Cloud or On-Premises
Google Looker Screenshot
Looker Business Intelligence is a cloud-hosted business intelligence software. [It was acquired by Google in 2019](https://techcrunch.com/2019/06/06/google-to-acquire-analytics-startup-looker-for-2-6-billion/). It combines with Google Cloud to provide customers with a multi-cloud analytics platform. Looker is known for its ease of use and collaboration features. It enables users with minimal SQL knowledge to create custom visualizations, dashboards, and reports. The platform supports a wide range of data sources and provides real-time data exploration capabilities.
Price Range
   $     $     $     $     $   
   $     $     $     $     $   
Starting Price
$5,000/month
Client OS
Windows
Deployment
Cloud Hosted
Domo Screenshot
Domo is a business intelligence and data visualization platform that excels in aggregating data from multiple sources into cohesive, visually appealing dashboards. Domo is designed to make data analytics accessible to all members of an organization via ease of use and a mobile app, promoting data-driven decision-making across various levels. Key features include extensive app connectivity, interactive and collaborative tools, and robust data manipulation capabilities.
Price Range
   $     $     $     $     $   
   $     $     $     $     $   
Starting Price
$83/month
Client OS
Web
Deployment
Cloud Hosted
QlikView Screenshot

QlikView

Discover deeper insights by building your own rich, guided analytics applications with a flexible, business-ready solution. Create business-driven data discoveries with guided analysis paths that are highly customizable and tightly governed. Guided analytics: Beautiful, controlled analytic experiences guide employees toward discovering insights and making meaningful decisions; Secure: Top-down control of analytics apps, permissions and data management; and Centralized Apps: Granular control of
Price Range
   $     $     $     $     $   
   $     $     $     $     $   
Starting Price
$29/month
Client OS
Web
Deployment
Cloud Hosted
SAP Crystal Reports Screenshot
SAP Crystal Reports is a business intelligence software designed to generate analytical reports from various data sources, including SAP, Oracle, SQL Server, and MySQL. It helps companies develop dynamic, advanced-level reports in up to 24 languages. SAP Crystal Reports allows offline and online access to information from various apps, portals, and mobile devices. It offers broad data connectivity across different organizational sources on various Windows operating systems.
Price Range
   $     $     $     $     $   
   $     $     $     $     $   
Starting Price
$495/user (perpetual license)
Client OS
Windows
Deployment
On-Premises
Microsoft Power BI Screenshot
Power BI is a data visualization and analytics tool from Microsoft, letting businesses transform raw data into meaningful insights. Free and paid versions help create custom reports. Its integration with other Microsoft products enhances its appeal to those familiar with the Microsoft ecosystem.
Price Range
   $     $     $     $     $   
   $     $     $     $     $   
Starting Price
$10/user/month
Client OS
Windows, iOS, Android, Web
Deployment
Cloud or On-Premises
Jedox Screenshot

Jedox

Jedox is an enterprise performance management and BI unified software solution. Jedox aims to streamline your planning process, unite users and data on one platform, and improve your businesses budgeting and forecasting. Jedox lets your plan, analyze, and report through one integrated EPM software. The corporate performance management solution gives insights and guidance to everyone in your company whether they are in the finance department, sales, or human resources. If your staff is stubborn
Price Range
   $     $     $     $     $   
   $     $     $     $     $   
Starting Price
$160/month
Client OS
Windows, iOS, Android, Web
Deployment
Cloud or On-Premises
IBM Cognos Screenshot

IBM Cognos

IBM Cognos Analytics software provides personalized analytics driven by artificial intelligence (AI). It enables organizations to become top-performing and analytics-driven entities. From business intelligence to financial performance and strategy management, IBM Cognos Analytics software is designed to help everyone in your organization make the decisions that achieve better business outcomes—today and in the future. IBM Cognos Analtyics includes flexible deployment options, either on cloud or
Price Range
   $     $     $     $     $   
   $     $     $     $     $   
Starting Price
$70/user/month
Client OS
Windows, Linux, iOS, Android
Deployment
Cloud or On-Premises
Oracle Business Intelligence 12c Screenshot

Oracle Business Intelligence 12c

Analytics should be more than a mirror of the past. As a strategic practice, it offers the ability to understand what is happening in the moment, and help you predict where your business can go. Making analytics a strategic practice requires a strategic platform that serves the entire organization’s needs—from the agility of visual analytics and self-service data discovery, to the power of an enterprise platform, including operational analysis at scale, security, reliability, extreme
Price Range
   $     $     $     $     $   
   $     $     $     $     $   
Starting Price
$150/user/month
Client OS
Web
Deployment
Cloud Hosted
SAP Analytics Cloud Screenshot

SAP Analytics Cloud

★★★★★
★★★★★
(1)
SAP Analytics Cloud is a business intelligence and data visualization software. Its key features include predictive analytics, predefined reporting, and enterprise planning. The platform enables the creation and linking of financial and operational plans in one system. Additionally, SAP Analytics Cloud can connect to SAP HANA, SAP S/4HANA, SAP BW/4HANA, and non-SAP sources like SQL and Google BigQuery.
Price Range
   $     $     $     $     $   
   $     $     $     $     $   
Starting Price
$36/user/month
Client OS
iOS, Web
Deployment
Cloud Hosted
Zoho CRM Screenshot

Zoho CRM

★★★★★
★★★★★
(3)
Zoho CRM is a customer relationship management software catering to most business sizes and types. Key features include lead tracking, business intelligence, AI-powered predictions and recommendations, and sales performance analytics. It offers flexibility in customization and integration capabilities, along with a mobile app.
Price Range
   $     $     $     $     $   
   $     $     $     $     $   
Starting Price
$14/user/month
Client OS
iOS, Android, Web
Deployment
Cloud Hosted
ClearPoint Screenshot

ClearPoint

★★★★★
★★★★★
(1)
Don’t just build reports, dashboards, and scorecards; wow your executive team with your management insight. Use ClearPoint to quickly and easily combine text and graphical information to make dynamic and compelling management, strategy, or Balanced Scorecard reports. ClearPoint makes complex management reporting easy. ClearPoint is reporting and Balanced Scorecard software built BY managers, FOR managers. You don’t have to worry about cryptic commands or configuration. It’s all drag and drop,
Price Range
   $     $     $     $     $   
   $     $     $     $     $   
Starting Price
$50/user (perpetual license)
Client OS
Web
Deployment
Cloud Hosted
Jaspersoft Screenshot
TIBCO Jaspersoft is a business intelligence tool that provides embedded analytics and reporting for enterprises. The solution aims to free up staff from spending time on analytics by showing answers from applications easier. Key functionalities include administration via a web interface, live connection to external data, and comprehensive reporting capabilities with pixel-perfect reports, customizable dashboards, and report formatting templates. The platform also provides advanced data discovery and visualization tools, such as pre-built visualization formats and geographic visualization.
Price Range
   $     $     $     $     $   
   $     $     $     $     $   
Client OS
Windows, macOS, Web
Deployment
Cloud Hosted
Klipfolio Screenshot
Klipfolio is a cloud-based, business intelligence dashboard platform that connects to numerous data sources to provide real-time, accurate data visualizations. There are two products: the classic Klip and the new PowerMetrics. The former is focused on building real-time dashboards and visual reports. The altter is a metrics platform. Both tools allow businesses to make well-informed decisions supported by data, offering dashboards that are both visually appealing and customizable. With Klipfolio, users can effectively monitor their business’s health, reducing the time and effort spent on continuous data analysis.
Price Range
   $     $     $     $     $   
   $     $     $     $     $   
Starting Price
$250/month
Deployment
Cloud Hosted
Microsoft FRx Screenshot
Microsoft FRx was a specialized financial reporting tool that helped organizations streamline their financial close process and improve decision-making through enhanced reporting capabilities. The software was known for its ability to integrate with over 50 financial accounting systems and to pull financial information directly from the General Ledger, ensuring up-to-date and accurate financial reporting. FRx’s user-friendly design included wizards and customizable templates which made it accessible to users with varying levels of financial knowledge. FRx is no longer supported by Microsoft and is compatible only with older Windows versions, which could pose significant risks and limitations for continued use. The recommended replacement is [Microsoft Management Reporter](/bi-tools/microsoft-management-reporter/).
Client OS
Windows
Infor F9 Screenshot

Infor F9

★★★★★
★★★★★
(1)
Infor F9 is a financial reporting and analysis software that integrates with Microsoft Excel, offering dynamic linking of general ledger data to Excel. This integration allows for rapid real-time viewing and analysis of business information, streamlining the reporting process. It’s compatible with a wide range of commonly used ERPs, including Infor, Sage, Microsoft Dynamics, SAP, and SYSPRO.
Price Range
   $     $     $     $     $   
   $     $     $     $     $   
Starting Price
$1,500 (perpetual license)
Client OS
Windows
Deployment
On-Premises
Sage Intelligence Reporting Screenshot

Sage Intelligence Reporting

★★★★★
★★★★★
(1)
The Sage Intelligence Reporting add-on for Sage 50c empowers you to quickly and easily obtain the information required for improved operations and reporting across your entire business. Sage Intelligence gives you the freedom to tweak your reports or create new reports from scratch to suit your business needs. Based on the familiar Microsoft Excel ® application, the Business Intelligence module lets you effortlessly create reports and analyze data, improving your visibility into your
Price Range
   $     $     $     $     $   
   $     $     $     $     $   
Client OS
Windows, Web
Deployment
Cloud or On-Premises
Financial Statement Generator Screenshot

Financial Statement Generator

★★★★★
★★★★★
(1)
FSG is a user-friendly program that assists accountants in generating financial statements in a flash! Even if you prepare financial statements using a word processor, you must still setup margins, tabs, underlining, and double underlining. FSG eliminates all these page formatting chores by automatically setting up the page for you. Dollar signs appear where they are required, columns setup is automatic, underlining and double underling are printed on the correct locations on the page. All you
Price Range
   $     $     $     $     $   
   $     $     $     $     $   
Starting Price
$79 (perpetual license)
Client OS
Windows
Deployment
On-Premises
Jet Reports Screenshot

Jet Reports

You can save time previously spent copying and pasting data. You can save money previously spent on expensive, complicated reports that are obsolete after one use. Get reports from any module in your database such as financials, customer sales, payables, vendor activity, AR, personnel and more. View your operations in one report, global, divisional, and departmental. Track revenue and costs broken out the way you need. Refresh your reports any time to get the latest data and drill down to get
Price Range
   $     $     $     $     $   
   $     $     $     $     $   
Starting Price
$7,995 (perpetual license)
Client OS
Windows, Web
Deployment
Cloud or On-Premises

We searched and searched, but we couldn’t find any products in our database that match your criteria. Perhaps our team of software experts can help? They’d be happy to provide a list of free the best reporting tools recommendations that meet your exact requirements.

Sort by 
Filter by User Rating
Filter by Price Range
Filter by Deployment
Filter by Client OS
LinkedIn
Buyer’s Guide

What Are Reporting Tools?

Reporting tools is a type of business intelligence tool that creates reports that let you view trends pertaining to company financials, sales, marketing, human capital management, and more. Reporting tools will give you the power to make tough decisions on underperforming departments or personnel, or the insight needed to duplicate a business process given its success.

Reporting tools create reports by having a designer upload information from datasets (such as accounting software or a CRM), which help create interactive reports such as income statements, cash flows, employee attendance, benefits administration, the status of leads generated, revenue by salesperson, and more.

Reporting tools help you prepare your data, upload your data, and build a report that provides real-time information to improve your business decision making.

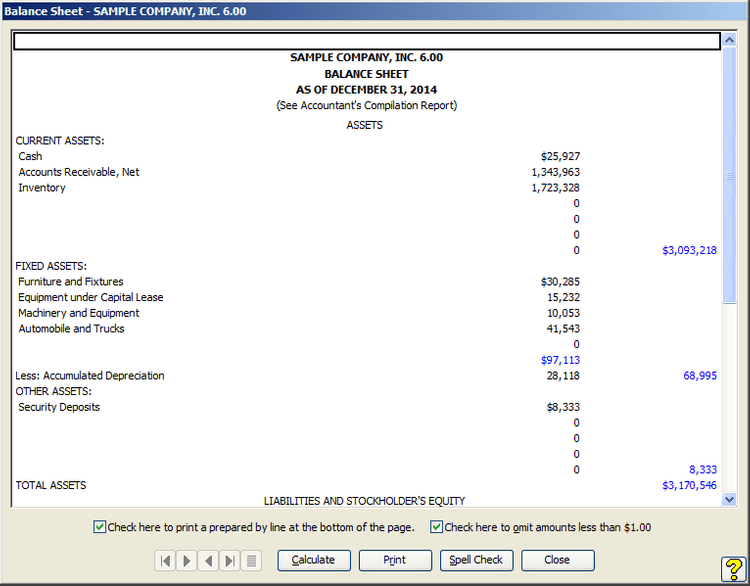
Reports generated in reporting tools can be as basic as advanced financial statements that your general ledger can’t create on its own (such as a profit and loss statement or a balance sheet), or as complicated as a certified payroll report or an executive dashboard that pulls data from multiple systems.

Financial Statement Generator Reporting Tools Balance Sheet Example
An example of a balance sheet provided by Financial Statement Generator which helps create reports with data from your general ledger.

Features of Reporting Tools

Feature Description
Ad-Hoc Queries A non-standard inquiry created to obtain information as the need arises.
Data Visualizations Creates a visual means of enabling rapid consumption of key business data, primarily in the forms of charts, graphs, and plots.
Interactive Dashboards A type of data visualization that displays key performance indicators (KPIs) and important data points to allow for quick visualization of the selected data.
Data Blending Import data from multiple sources such as Excel spreadsheets, accounting software, and ERP systems. Export data to a third party file type such as a CSV or PDF file.
Reporting Tools Sisense Interactive BI Dashboard
The interactive BI dashboard in Sisense can show productivity levels of employees based on time spent in specific workflows.

Benefits of Reporting Tools

Understand Your Data Better With Visualizations

Data is the main driving force behind most decisions. Reporting software can help provide the appropriate layer of abstraction to tell the necessary story with your data, in the form of a visual. Visualizations help communicate data easier in a way that can elicit the appropriate response from the target audience. For example, a spreadsheet that has sales data can help show quarterly sales to important decision-makers, but it can also help understand the motives behind why your sales may have increased or decreased lately.

Increase Productivity With Integrations

Reporting tools will operate as their own program, and in many cases may ask you to upload the data set you need to analyze. However, many reporting tools can now integrate or embed with your existing business software (such as an ERP solution) without much modification. This gives your business reporting capabilities directly into the financial or ERP program you use and can speed up the creation of any needed interactive reports.

Real-Time Analytics and KPIs

Real-time reporting gives you updated business intelligence based on your data analysis as they happen. Rather than waiting for reports to update over a predetermined length of time (such as with annual budgets or a monthly financial report), managers can see their exact figures as they change, in order to make more informed decisions at a quicker pace.

SAP Crystal Reports Reporting Tools Recruitment Dashboard
A recruiting dashboard in SAP Crystal Reports helps visualize the cost of acquiring an employee.

Reporting Tools for BI

At the core of any business intelligence software is the reporting functionality. BI reporting software provides a full view of your business with self-service analytics and reporting that can help you create interactive dashboards, visuals, KPIs, and more into easy to read reports for your business decision makers to understand.

Most BI tools have a strong reporting capability which offers drag-and-drop capabilities that basic end users can understand. This can let you adjust tables and data sources to your liken to see what type of report pops out.

Static vs Real-Time Reporting

You’ll want to determine how complex your reporting tool needs to be. Most classic or basic reporting tools will provide static reporting capabilities, while advanced BI tools provide real-time analytics in your reporting or dashboards.

Static reporting provides information data that is current up to the date that the report was created. Static reporting is less likely to change over time and is thus used in more big-picture discussions, such as year-end budgets or monthly financial statements. These types of reports are more commonly found in on-premise reporting tools.

Static reporting is what is thought of in traditional reporting in the early days of spreadsheets and manual (paper) reports that are distributed out to employees. Static reports can become easily dated and have mostly been moved aside in reporting tools for real-time reports.

Real-time reports can be accessed from a variety of devices via the cloud with internet connections. These reports provide up to the minute details to key business data, such as sales levels, stock counts in your inventory, and more.

Real-time reporting software capabilities help decisions be made in seconds. For example, if your inventory counts are getting too low, your purchasing manager can be properly notified so that stock can be replenished. This can help you avoid having to turn down sales orders due to a longer-than-expected fulfillment window.

The above scenario is an example of how real-time reporting has an advantage over static reporting to increase the power of your brand and of your market performance.

Reporting Tools in Excel

When is Excel useful to be used as a reporting tool? Is it possible to continue to use Excel as the primary source of data and have another program create reports?

Given the presence of Excel in the workplace (there are 1.2 billion Office users as recent as 2016), many will want to utilize the solution for reporting purposes. An office that primarily uses Excel usually benefits from the following:

  • Familiarity with the program. Most people are familiar with the layout of spreadsheet software and have experience using one in college, at internships, or at another job. Because of this, there is little to no learning curve needed to get new employees properly recording data.
  • Templates and formulas to aggregate data. Excel has a few built-in features and provides a wizard tool to help you create what is necessary. Given the vast user base, there are many communities online dedicated to helping you learn advanced capabilities.
  • As low cost as you can get. Excel is included as a part of MS Office, which previously came with the purchase of a lot of new computers. Nowadays, business users can expect to spend $8.25/user/month for Outlook, Word, Excel, PowerPoint, and more.

However, Excel was intended to be a place to store your data, and not to operate as a reporting tool. Offices that grow a dependency on Excel or spreadsheets may eventually have to deal with:

  • Human error. When a dataset gets large enough, so does the chance for error. Missing a decimal place or typing a “0” instead of a “1” can drastically change your numbers and thus produce inaccurate reports.
  • Static data and collaboration issues: As previously mentioned, real-time data has plenty of benefits over static data, and companies looking to create reports as current as possible will have to deal with data potentially being outdated. Some cloud-based spreadsheets such as Google Docs can assign multiple end users editing privileges, which means if you have the spreadsheet pulled up on your computer, it will have the same data set as anyone else that may be viewing the file.

Many reporting tools will offer the import of Excel files (.CSV) or any other type of spreadsheet to create the reports you desire. They may also provide you the ability to use the familiar functionality of Excel directly within the program, or some type of hybrid approach where the reporting solution operates as an extension to Excel.

A level of integration can avoid the manual process of conversion, or avoid the process of tracking data in one program (your spreadsheet program) and reports in your reporting software. Not only that, but it provides little to no learning curve to letting your Excel-fluent employees create the reports they want.

While Excel can be a low-cost and useful tool, it doesn’t mean it can truly be a “reporting tool” without the aid of the right software.