The Best Data Analysis Tools

Get the best software for your business. Compare product reviews, pricing below.

Talk with a software advisor
Talk with an advisor
Get a free consultation from an independent expert.
Or, call toll-free: (800) 827-1151
Talk with a software advisor
Talk with an advisor

Popular Products

No products found
Tableau Screenshot

Tableau

★★★★★
★★★★★
(13)
Tableau is business intelligence software that allows anyone to connect to data in a few clicks, then visualize and create interactive, sharable dashboards with a few more. It’s easy enough that any Excel user can learn it, but powerful enough to satisfy even the most complex analytical problems. Securely sharing your findings with others only takes seconds. The result is BI software that you can trust to actually deliver answers to the people that need them. ::: alert UPDATE: On 6/10/2019,
Price Range
   $     $     $     $     $   
   $     $     $     $     $   
Starting Price
$70/user/month
Client OS
Windows, Web
Deployment
Cloud or On-Premises
Microsoft Power BI Screenshot
Power BI is a data visualization and analytics tool from Microsoft, letting businesses transform raw data into meaningful insights. Free and paid versions help create custom reports. Its integration with other Microsoft products enhances its appeal to those familiar with the Microsoft ecosystem.
Price Range
   $     $     $     $     $   
   $     $     $     $     $   
Starting Price
$10/user/month
Client OS
Windows, iOS, Android, Web
Deployment
Cloud or On-Premises
Domo Screenshot
Domo lets you connect your business to improve your decision-making. The software lets your integrate multiple data sources, store information, prepare reports, visualize your data, collaborate with other employees/departments, predict trends, and do more with your data via pre-built and custom apps. Domo provides solutions for the following industries: Education; Financial Services; Healthcare; High Tech; Hospitality; Manufacturing; Media and Entertainment; Professional Services; Retail and
Price Range
   $     $     $     $     $   
   $     $     $     $     $   
Starting Price
$83/month
Client OS
Web
Deployment
Cloud Hosted
Sisense Screenshot
Sisense is a business analytics platform that cleans your data, provides interactive visual analytics, and delivers insights. Sisense provides customized dashboards based on your industry. The solution can grab data from multiple sources, providing a level of analyzing to help you make important decisions, and finally create the visual analytics via dashboards that your reporting desires. Mash Up: Connect and analyze data from multiple sources; Analyze: Personalized dashboards, interactive
Price Range
   $     $     $     $     $   
   $     $     $     $     $   
Starting Price
$4,200/user (perpetual license)
Client OS
Windows, Web
Deployment
Cloud or On-Premises
SAP BusinessObjects Screenshot
To consistently manage your company’s performance, you need the ability to develop timely and accurate plans and budgets that are aligned with strategic goals. You also need the ability to seamlessly integrate corporate and departmental planning, quickly model business scenarios, and re-forecast to meet rapidly changing business conditions. Finally, you need a way to ensure a fully documented audit trail and compliance with strict guidelines for consolidating and reporting company information
Deployment
Cloud Hosted
Dundas BI Screenshot
Dundas BI is a dashboard, reporting, and analytics platform providing flexible business intelligence. Dundas BI lets all of your users collect data insights to better look into stats and data collected by your company. Dundas BI is used by both organizations and software vendors. Organizations can unlock data insights they need to make important business decisions. Software Vendors can use Dundas BI to give real-time data access directly in their program. @youtube The features of Dundas BI
Price Range
   $     $     $     $     $   
   $     $     $     $     $   
Starting Price
$6/user/month
Client OS
Windows, Web
Deployment
Cloud or On-Premises
Alteryx APA Screenshot

Alteryx APA

★★★★★
★★★★★
(1)
Alteryx is the launchpad for automation breakthroughs. Be it your personal growth, achieving transformative digital outcomes, or rapid innovation, the results are unparalleled. The unique innovation that converges analytics, data science and process automation into one easy-to-use platform, empowers everyone and every organization to make business-altering breakthroughs the new status quo. @youtube Automating asset inputs; Data quality and preparation; Data enrichment and insights; Data science
Price Range
   $     $     $     $     $   
   $     $     $     $     $   
Client OS
Windows, macOS, Web
Deployment
Cloud or On-Premises
Birst BI Screenshot

Birst BI

Birst is a cloud-based business intelligence platform that enables businesses to analyze, explore, and visualize big data. It is designed to be a native cloud application and hence comes with low TCO in both public and private cloud or on-premise via an appliance. Self-service Business Intelligence; Data warehouse Automation; Agile Business Analytics; Dashboards; Reports; In-memory Analytics; Ad Hoc Reporting; Sales Analytics; and Finance, Wealth Management, Insurance and Cloud Business
Client OS
Windows, Web
Deployment
Cloud or On-Premises
Board Screenshot

Board

★★★★★
★★★★★
(2)
Within one single product BOARD offers all the functionalities needed to build any Business Intelligence Software and Corporate Performance Management application solutions, without the use of any programming. Its revolutionary toolkit approach, as well as delivering unrivaled speed in BI and CPM applications building, customization and maintenance, provides end-users with an advanced interactive interface.This unique capability turns the self-service creation of any report or analysis into the
Price Range
   $     $     $     $     $   
   $     $     $     $     $   
Client OS
Windows, iOS, Android, Web
Deployment
Cloud or On-Premises
Looker Screenshot
Looker is a business intelligence and big data software that harnesses the power of SQL to create powerful data analytics. Looker helps companies get value from their data and gives a 360 view of their customers. Looker provides a unified view of the organization so every department’s needs can be met and everyone an have a unified view. Looker can be set up quickly with pre-built applications, or at your own pace via custom work from a vendor. UPDATE: On 6/6/2019, Looker was acquired by Google.
Price Range
   $     $     $     $     $   
   $     $     $     $     $   
Starting Price
$300/user/month
Client OS
Windows
Deployment
Cloud Hosted
MicroStrategy Analytics Screenshot

MicroStrategy Analytics

★★★★★
★★★★★
(1)
Empower everyone with analytics from MicroStrategy. Use this platform to transform your business into an Intelligent Enterprise by instantly delivering personalized reports to thousands of users with self-service analytics. MicroStrategy provides the technology to make it happen. MicroStrategy’s powerful analytical engine, comprehensive toolsets, variety of data connectors, and scalable, open architecture ensure you have everything you need to extend access to analytics across every team and
Client OS
Windows, macOS, Web
Deployment
Cloud or On-Premises
QlikView Screenshot
Discover deeper insights by building your own rich, guided analytics applications with a flexible, business-ready solution. Create business-driven data discoveries with guided analysis paths that are highly customizable and tightly governed. Guided analytics: Beautiful, controlled analytic experiences guide employees toward discovering insights and making meaningful decisions; Secure: Top-down control of analytics apps, permissions and data management; and Centralized Apps: Granular control of
Price Range
   $     $     $     $     $   
   $     $     $     $     $   
Starting Price
$29/month
Client OS
Web
Deployment
Cloud Hosted
SAS Financial Intelligence Screenshot

SAS Financial Intelligence

★★★★★
★★★★★
(2)
SAS Financial Intelligence solutions provide consolidation, reporting, budgeting, planning and dashboards in a single solution and on one platform. With SAS, you can achieve financial transparency, ensure regulatory compliance, and gain predictive, analytic insight into financial performance. Our comprehensive offerings for Finance allow you to access the wealth of knowledge in your financial and non-financial data to adapt to the expanded role of trusted advisor at every level in the
Targit Business Intelligence Suite Screenshot

Targit Business Intelligence Suite

Business intelligence from TARGIT is developed with the concepts of user-friendliness, flexibility and simple implementation in mind and it is top priority to TARGIT to minimize the number of clicks to business insight. TARGIT BI Suite streamlines the decision processes in your company, focusing on user-friendliness and close integration of business intelligence disciplines like analysis, reporting and dashboarding. The solution gathers data from all of your company’s systems and gives all
TIBCO Spotfire Screenshot
TIBCO Spotfire software offers an analytics platform that delivers visual, predictive, and streaming analytics. TIBCO makes it possible to unlock the potential of your real-time data for making faster, smarter decisions. With the Spotfire analytics platform, and the TIBCO Hyperconverged Analytics advantage, you get a seamless, single-pane-of-glass experience for visual analytics, data discovery, and point-and-click insights. Immerse yourself in both historic and real-time data, interactively:
Price Range
   $     $     $     $     $   
   $     $     $     $     $   
Starting Price
$1,300/user/year
Client OS
Windows, macOS, iOS, Web
Deployment
Cloud or On-Premises
Zoho CRM Screenshot

Zoho CRM

★★★★★
★★★★★
(3)
Zoho CRM is an online business management platform that caters to the needs of businesses of all types and sizes. The features allow you to track leads, nurture them along the sales funnel, and collaborate in real time and monitor business trends from a centralized hub.
Price Range
   $     $     $     $     $   
   $     $     $     $     $   
Starting Price
$14/user/month
Client OS
iOS, Android, Web
Deployment
Cloud Hosted
Chartrics Screenshot

Chartrics

Chartrics is designed to seamlessly transform the collected research data (Excel, SPSS) into PowerPoint reports, share them with customers, and automatically reproduce the existing reports with new data. All without leaving your PowerPoint workspace. Integrated Chart Maker allows you to visualize your data or cross variables against each other with the drag-and-drop function, perform standard data manipulations - sort and filter variables, group and replace variable categories, paint the charts
Starting Price
$75/user/month
Client OS
Windows
Deployment
Cloud Hosted
ETO Screenshot

ETO

★★★★★
★★★★★
(1)
ETO by Social Solutions is a case management software with an emphasis on efforts-to-outcomes. Become data-driven and make informed decisions through aggregate and visualized data. Save time, serve more people, and work smarter with time-saving features and best practices offered by ETO software. Report library : Get started with proven best practice reports.; Advanced report building : Consolidate and visualize data to meet reporting needs and make informed decisions.; Dashboard reporting :
Client OS
Web
Deployment
Cloud Hosted
AskTreez Screenshot

AskTreez

The AskTreez Data Analytics platform provides cannabis retailers with real-time insights and in-depth inventory knowledge to create comprehensive, centrally-managed retail management dashboards to report across their entire operation. Start making more informed business decisions around your sales strategies, marketing efforts, store management, and supply chain planning. AskTreez works with other Treez products, such as: SellTreez ; BrandTreez ; and TreezPay . Help your retailers sell more with
Client OS
Web
Deployment
Cloud Hosted

We searched and searched, but we couldn’t find any products in our database that match your criteria. Perhaps our team of software experts can help? They’d be happy to provide a list of free the best data analysis tools recommendations that meet your exact requirements.

Sort by 
Filter by User Rating
Filter by Price Range
Filter by Deployment
Filter by Client OS
LinkedIn
Buyer’s Guide

What are Data Analysis Tools?

Data analysis tools are designed to assist companies with reviewing, visualizing, and modeling their important data in order to inform better decision-making. This analytics solution performs in two ways: the first is to provide businesses with automated processes for collecting raw data and turning it into readable content via complicated algorithms. The second is to process data which can then be used to reveal patterns to influence your upcoming decisions.

Related to business intelligence systems, data analysis software tools are a more specified solution for helping review key performance indicators (KPIs) and forecasting important events. Decision-makers can use this detailed business analytics to back up and defend their upcoming choices for the company with solid evidence.

Features of Data Analysis Tools

  • Data mining: Collect all your data and begin sorting it into datasets based on selected categories
  • Data source connectors: Compile your existing data sets from multiple sources into one platform in order to find instances of connectivity between key performance indicators (KPIs)
  • Data inspection: Clean up data to prevent duplication errors
  • Embedded analytics: Collect your KPI data right from the source by embedding analytical tools directly into your business processes
  • Query building: Use natural language search to generate an easy-to-operate user interface for requesting specific data from your database
  • Data visualization and reporting: Build graphs, charts, and scorecards out of historical data to discover useful information about your business operations and supporting decision-making
  • Data modeling and predictive analytics: Use real-time and historical data visualizations to predict and forecast future events
  • Machine learning: Use artificial intelligence (AI) tools to perform multidimensional analysis of raw data through complex calculations

Benefits of Data Analysis Tools

There are many benefits to using data analysis software in your decision-making process:

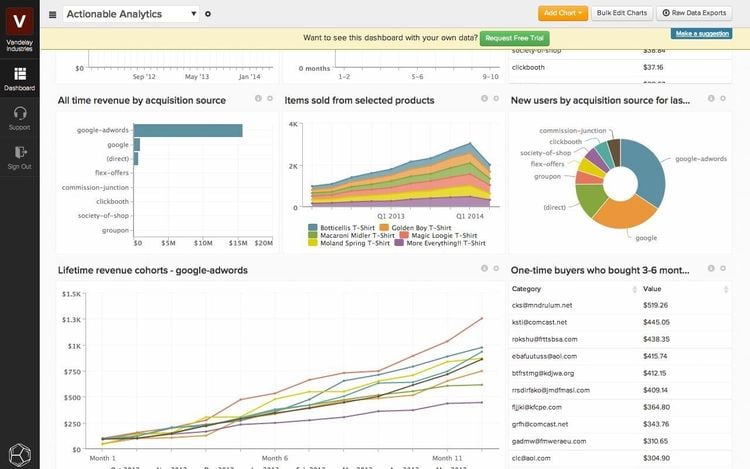
Turn Data into Actionable Insights

The main benefit of data analysis is the ability to review real-time and historical data, then use the resulting information to enhance your decision-making process. Embedded analytics tools collect the raw data right from the source, whether it’s an internal software or customer-facing eCommerce website. Data can also be collected from manual actions recorded by employees into the data analysis system.

There are many different ways data can be used to create actionable insights. For example, a hotelier can identify their peak season by analyzing historical data related to guest booking and travel trends. Knowing when they’re most likely to be busy lets them properly schedule staff and order supplies far in advance. Not only can in-depth analysis reveal when booking will hit a peak, it can show what type of guests are most likely to be checking in, allowing the hotelier to better accommodate their needs.

Domo Software
Domo provides actionable analytics to improve your decision-making.

Finding the right data can be tricky, especially if you don’t know where to start. Excel spreadsheets can contain a lot of data, but it’s difficult to recall specific information at any time without a deep knowledge of programming languages. Fortunately, data analysis tools with natural language search lets you start by defining data in understandable terminology. You can then build interactive queries based on your own preferred language through the use of machine learning and AI.

How you categorize your data can affect your business decisions moving forward. For example, if your data reveals your top customers are middle-class, middle-aged men, you can change your marketing tactics to better reach your target. Or you can analyze when visitors are most often on your eCommerce site and set scheduled advertisements to directly appeal to these customers.

With data analysis software tools, you can define your first-party data based on different demographics:

  • Age
  • Gender
  • Relationship status
  • Family status
  • Income
  • Online engagement/social media presence
  • Location
  • Nationality

Rather than hire a data scientist to perform statistical analysis on every different metric, self-service data analysis tools let you use natural language processing to find the exact information you want.

Forecast the Future with Predictive Analytics

As mentioned before, data analytics software first works by gathering data and then offers the analysis. This second part is when forecasting and predictive analytics applications get to work. Using these tools helps you understand the impact of past decisions on your current business performance. Then use those findings as a jumping off point to understand the impact of future decisions.

In the past, manual data analysis could mean hours or days of manually calculating different variables. The growing automaton of data management means you don’t have to spend as much time entering data into your analytics platform. Instead, data analytics tools let you get straight to forecasting.

Tableau BI Software
Use campaign data from Tableau to find ways to optimize your business processes.

Data Analysis by Industry

Several industries benefit from data analysis tools, though the primary benefactors are:

  • Healthcare because of the high amount of variable data from different patients, departments, and facilities within a healthcare network
  • Manufacturing due to the time-based demands of production across a multi-echelon supply chain
  • Media and advertising in order to better target customers based on their demographics
  • Travel and hospitality due to the increasingly fast guest turnover rates
  • Retail to tailor their sales to the highly specific buying habits of consumers

Companies in any industry can use data analysis tools to their advantage.

Microsoft Power BI Software
Retailers can review year-to-date sales with Microsoft Power BI.

How Does Data Analysis Compare to BI?

Data analysis and business intelligence (BI) tools cover some of the same services. Both provide in-depth analysis of real-time and historical data with the goal of improving decision-making. However, BI tools have considerably more features like:

  • OLAP
  • Big Data
  • KPIs
  • Data integration
  • Financial modeling

Essentially, most business intelligence software includes some form of data analysis. All of these additional tools may slow down your analysis processes, especially if you’re a smaller business with limited datasets, so implementing a single data analysis tools may be more appropriate for your company.

Data analysis tools can store large amounts of data sets simultaneously. However, there are some limitations when gathering Big Data from multiple sources since they include non-relational databases (NoSQL) and relational parallel processing databases. If your company depends more on large data sets, consider a big data analytics tool. Otherwise, data analytics software is a user-friendly option for smaller or single-source datasets.