The Best Data Visualization Tools

Get the best software for your business. Compare product reviews, pricing below.

Talk with a software advisor
Talk with an advisor
Get a free consultation from an independent expert.
Or, call toll-free: (800) 827-1151
Talk with a software advisor
Talk with an advisor

Popular Products

No products found
Tableau Screenshot

Tableau

★★★★★
★★★★★
(13)
Tableau is a business intelligence and data visualization tool. It excels in creating easy-to-understand visualizations from complex data, facilitating informed decision-making. Tableau’s user-friendly interface, with drag-and-drop capabilities, allows users with varying technical expertise to create dynamic, interactive reports and dashboards, enhancing data exploration and collaboration​
Price Range
   $     $     $     $     $   
   $     $     $     $     $   
Starting Price
$75/user/month
Client OS
Windows, Web
Deployment
Cloud or On-Premises
Sisense Screenshot
Sisense, formerly Periscope Data, is a business intelligence tool offering data management and visualization capabilities. It provides ease of setup, connecting seamlessly to a wide variety of data formats and platforms. The software enables fast data alterations and updates, and its analytics platform, Sisense Fusion, uses AI and machine learning for data analysis.
Price Range
   $     $     $     $     $   
   $     $     $     $     $   
Starting Price
$4,200/user (perpetual license)
Client OS
Windows, Web
Deployment
Cloud or On-Premises
Microsoft Power BI Screenshot
Power BI from Microsoft is a suite of business analytics tools designed for data analysis and sharing insights. It offers a view of critical business metrics in real time, accessible on any device. Users can explore data with visualization tools and utilize over 50 connections to popular business applications and pre-built dashboards. The Power BI Mobile apps ensure that data and reports are always up-to-date and accessible from anywhere. It allows the combination of data from various sources, automatic data quality fixes, and the creation of reports with built-in and custom visuals. Power BI gateways connect SQL Server databases, A.I. models, and other data sources to Power BI dashboards. Additionally, Power BI reports and dashboards can be embedded into existing portals or applications for a unified experience using Power BI Embedded Analytics.
Price Range
   $     $     $     $     $   
   $     $     $     $     $   
Starting Price
Free
Client OS
Windows, iOS, Android, Web
Deployment
Cloud or On-Premises
Domo Screenshot
Domo is a business intelligence and data visualization platform that excels in aggregating data from multiple sources into cohesive, visually appealing dashboards. Domo is designed to make data analytics accessible to all members of an organization via ease of use and a mobile app, promoting data-driven decision-making across various levels. Key features include extensive app connectivity, interactive and collaborative tools, and data manipulation capabilities.
Price Range
   $     $     $     $     $   
   $     $     $     $     $   
Starting Price
$83/month
Client OS
Web
Deployment
Cloud Hosted
Datawrapper Screenshot

Datawrapper

★★★★★
★★★★★
(1)
Datawrapper is a data visualization tool that creates charts and maps for journalists, software developers, and other design professionals. Key features include importing data from various sources like Excel and Google Sheets, live-updating capabilities, and a wide selection of chart types and styles. The software supports various data import methods, including direct Excel and Google Sheets uploads.
Price Range
   $     $     $     $     $   
   $     $     $     $     $   
Starting Price
$599/month
Client OS
Web
Deployment
Cloud Hosted
FusionCharts Screenshot

FusionCharts

FusionCharts provides JavaScript charts for web and mobile dashboards. The software includes over 100 interactive charts and over 1,400 data-driven maps. This includes popular charts such as bar, column, line, area, and pie. The software integrates with any JavaScript framework or server-side programming language. FusionCharts provides over 20 dashboards for all business use-cases. Some examples of these include: Energy Monitoring; Sales Management; Shipment Analysis; Manufacturing Quality;
Price Range
   $     $     $     $     $   
   $     $     $     $     $   
Starting Price
$497 (perpetual license)
Client OS
Web
Deployment
Cloud or On-Premises
Infogram Screenshot

Infogram

Infogram helps create infographics, reports, and maps for your organization. Infographics from Infogram help you tell a compelling data-driven story and present your content with easy to understand data that grabs the viewers attention. Infogram operates as a data visualization tool with the goal of making your data easy to understand, discovering unknown facts/outliers/trends, visualize relationship patterns, and ask better questions. Included in the software is 35 charts and 550 maps. Infogram
Price Range
   $     $     $     $     $   
   $     $     $     $     $   
Starting Price
$19/month
Client OS
Web
Deployment
Cloud Hosted
IBM Cognos Screenshot

IBM Cognos

IBM Cognos Analytics software provides personalized analytics driven by artificial intelligence (AI). It enables organizations to become top-performing and analytics-driven entities. From business intelligence to financial performance and strategy management, IBM Cognos Analytics software is designed to help everyone in your organization make the decisions that achieve better business outcomes—today and in the future. IBM Cognos Analtyics includes flexible deployment options, either on cloud or
Price Range
   $     $     $     $     $   
   $     $     $     $     $   
Starting Price
$70/user/month
Client OS
Windows, Linux, iOS, Android
Deployment
Cloud or On-Premises
QlikView Screenshot

QlikView

Discover deeper insights by building your own rich, guided analytics applications with a flexible, business-ready solution. Create business-driven data discoveries with guided analysis paths that are highly customizable and tightly governed. Guided analytics: Beautiful, controlled analytic experiences guide employees toward discovering insights and making meaningful decisions; Secure: Top-down control of analytics apps, permissions and data management; and Centralized Apps: Granular control of
Price Range
   $     $     $     $     $   
   $     $     $     $     $   
Starting Price
$29/month
Client OS
Web
Deployment
Cloud Hosted
TIBCO Spotfire Screenshot
TIBCO Spotfire is a business intelligence and data analytics software. The platform’s big data, content, predictive analytics features, and advanced collaboration tools make it a decent fit solution for medium to large enterprises. Spotfire also delivers machine learning capabilities and data discovery tools.
Price Range
   $     $     $     $     $   
   $     $     $     $     $   
Starting Price
$1,300/user/year
Client OS
Windows, macOS, iOS, Web
Deployment
Cloud or On-Premises
Zoho CRM Screenshot

Zoho CRM

★★★★★
★★★★★
(3)
Zoho CRM is a customer relationship management software catering to most business sizes and types. Key features include lead tracking, business intelligence, AI-powered predictions and recommendations, and sales performance analytics. It offers flexibility in customization and integration capabilities, along with a mobile app.
Price Range
   $     $     $     $     $   
   $     $     $     $     $   
Starting Price
Free
Client OS
iOS, Android, Web
Deployment
Cloud Hosted
SAP Analytics Cloud Screenshot

SAP Analytics Cloud

★★★★★
★★★★★
(1)
SAP Analytics Cloud is a business intelligence and data visualization software. Its key features include predictive analytics, predefined reporting, and enterprise planning. The platform enables the creation and linking of financial and operational plans in one system. Additionally, SAP Analytics Cloud can connect to SAP HANA, SAP S/4HANA, SAP BW/4HANA, and non-SAP sources like SQL and Google BigQuery.
Price Range
   $     $     $     $     $   
   $     $     $     $     $   
Starting Price
$36/user/month
Client OS
iOS, Web
Deployment
Cloud Hosted
Unit4 FP&A Screenshot

Unit4 FP&A

Unit4 FP&A offers a consistent platform for controlling all financial planning processes in a scalable and flexible manner. It focuses on automation and real-time data to help future-proof finances against complexities of growth and dynamic markets, moving away from traditional spreadsheet methods​​​​​​​​​​.
Price Range
   $     $     $     $     $   
   $     $     $     $     $   
Client OS
Windows, Web
Deployment
Cloud Hosted
Workday Adaptive Planning Screenshot

Workday Adaptive Planning

★★★★★
★★★★★
(3)
Workday Adaptive Planning is an enterprise performance management software for long-term budgeting and forecasting. It enables financial data consolidation, journal entries and reports, multi-currency management, and detailed audit trails. Workday also provides personalized dashboards, color-coded scorecards, a variety of KPIs, and cost and profitability analysis.
Price Range
   $     $     $     $     $   
   $     $     $     $     $   
Starting Price
$25,000/year
Client OS
Web
Deployment
Cloud Hosted
Zebra BI Screenshot

Zebra BI

Zebra BI is a data visualization tool that enhances reporting and analysis, particularly in corporate settings. It integrates with Microsoft Office and Power BI, offering IBCS-compliant visuals that are easy to understand and add to insightful reports. It can create comparisons between actuals, budgets, and forecasts for a full view of business performance.
Price Range
   $     $     $     $     $   
   $     $     $     $     $   
Starting Price
$58/month
Client OS
Windows
Deployment
On-Premises
Flex Planning Screenshot

Flex Planning

Flex Planning is a Business Performance Management solution that helps finance executives tackle the challenges related to budgeting, planning and forecasting. The product includes reporting and analytics, consolidation, and supports the creation of strategic planning, financial planning and operational planning in a single product. The centralized database optimizes and enhances your current spreadsheet files, reducing data redundancy, helping users accurately access up-to-the-minute data. Flex
Sage Enterprise Intelligence Screenshot

Sage Enterprise Intelligence

Your business has collected a massive amount of data—and it’s only just begun. It’s growing by leaps and bounds every day, and it’s coming from new sources across your organization. No wonder why it’s harder than ever to build a single, coherent picture of your business operations. Good news! Now you can transform that complex, fragmented data into meaningful information that has real decision-making power. Sage Enterprise Intelligence fully integrates with Sage 300 ERP, Sage 500 ERP, and Sage
Client OS
Web
Deployment
Cloud Hosted
Pivotier BIZ Screenshot

Pivotier BIZ

Designed for business users, Pivotier BIZ is easy, fast and colorful embedded reporting in both classic and role-tailored interfaces for Microsoft Dynamics NAV, without the need for experts to generate updates and small tweaks to your standard reports. End-users have been struggling for a decade or more to easily get reports from their NAV data. The ability to see all fields from C/SIDE tables has required advanced programming, has been almost impossible, or has required expensive external
KPI Cloud Analytics Screenshot

KPI Cloud Analytics

A cloud-based reporting and analytics platform specifically built for organizations who use NetSuite. KPI Cloud Analytics for NetSuite helps enable companies to gain maximum return from NetSuite ERP information quickly and at a lower cost than with other solutions. Users of KPI Cloud Analytics gain access to dynamic reports and powerful visualizations that are key for companies to drive insightful decision making Retail department managers and executive teams can often spend countless hours in a
Client OS
Web
Deployment
Cloud Hosted
Birst BI Screenshot

Birst BI

Birst is a cloud-based business intelligence platform that enables businesses to analyze, explore, and visualize big data. It is designed to be a native cloud application and hence comes with low TCO in both public and private cloud or on-premise via an appliance. Self-service Business Intelligence; Data warehouse Automation; Agile Business Analytics; Dashboards; Reports; In-memory Analytics; Ad Hoc Reporting; Sales Analytics; and Finance, Wealth Management, Insurance and Cloud Business
Client OS
Windows, Web
Deployment
Cloud or On-Premises

We searched and searched, but we couldn’t find any products in our database that match your criteria. Perhaps our team of software experts can help? They’d be happy to provide a list of free the best data visualization tools recommendations that meet your exact requirements.

Sort by 
Filter by User Rating
Filter by Price Range
Filter by Deployment
Filter by Client OS
LinkedIn
Buyer’s Guide

What Are Data Visualization Tools?

Data visualization tools create a visual means of enabling rapid consumption of key business data. The visualizations of big data will come in many forms, primarily charts, graphs, and plots. Data visualizations are just one of many types of BI tools available that engage the viewer, communicate the data, and elicit the appropriate response from the target audience. The data can come from a variety of sources, such as a spreadsheet in Excel or your accounting or ERP software.

Data visualization tools can be used by entrepreneurs and freelancers looking for analytics on their work, or by large enterprises looking to justify important business decisions.

Data visualizations provide the business intelligence needed to help interpret and present your data. Selecting the right data visualization tool for your data sets will help you accomplish your business goals.

What Visualizations Can You Create in Data Visualization Software?

There are seven major types of visualizations that can best exemplify big data:

  • Bar graphs
  • Pie charts
  • Line charts
  • Scatter plots
  • Bubble charts
  • Map charts
  • Meters

Which types of data visualizations will work best for your situation? Usually, your visualizations take two (or more) pieces of data and combine them to show a relationship, a distribution, or a composition. You’ll want to think about what your business is trying to share to pick the best data visualization software.

A relationship is a situation that exists between two pieces of data when one table has a foreign key that references the primary key of the other table. The distribution of a statistical data set is a listing or function showing all the possible values of the data and how often they occur. Composition means that the components are combined to form a compound.

Relationships

  • Deviation can help emphasize variations from a fixed reference point. These include diverging bars or spine charts.
  • Correlation shows the relationships between variables. These include scatterplots and combined line and column charts.
  • Ranking shows items in an ordered list based on their importance or value. This includes ordered bars or columns or a dot strip plot.
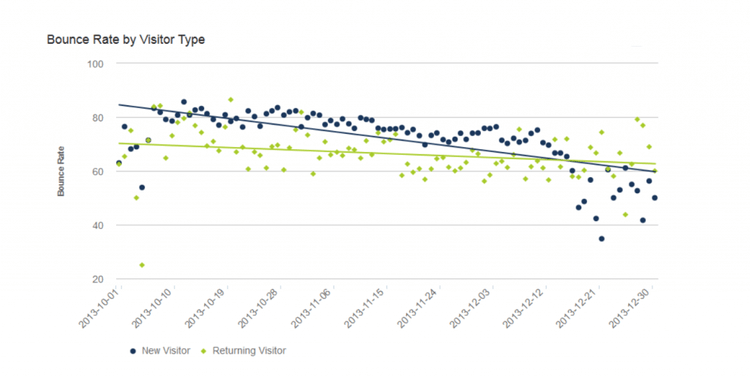
Scatterplot Example Data Visualization Tools
An example of a scatterplot which shows a correlation between two different sets of data.

Distribution

  • Distribution can show how often values occur in a dataset. This includes histograms and boxplots.
  • Changes over time show movements over time-periods. This includes line graphs and columns.
  • Part-to-whole can help break a single entity into different elements that are intended to be highlighted. This includes stacked columns, pie charts, Venn diagrams, and treemaps.
Line Graph Example Data Visualization Tools
This line graph example shows a change in a budget over a time period.

Composition

  • Magnitude shows size comparisons and can be both relative or absolute. This includes stacked bars or paired bars.
  • Spatial is used whenever locations or geographical patterns are being visualized. These include Choropleths and contour maps.
  • Flow is used to show movement between different states which can help trace the outcome of a process.
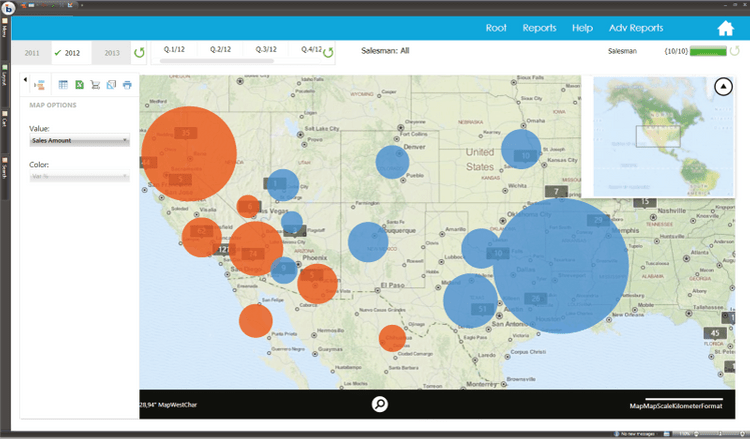
Map Graph Example Board Data Visualization Tools
An example of a map graph from Board.

But how do you best engage the viewer, communicate your data, and elicit the appropriate response? Choosing the best data relationship will be one of the most important parts of telling your story.

Questions To Ask

To determine if your data is best explained via a relationship, a distribution, or a composition, you’ll want to ask the following questions:

  • What story do you want to tell?
  • Who is your audience?
  • Are you trying to analyze a trend, showcase data, or compare two sets of data?
  • Is any of your data time-based or time-sensitive?
  • How does your data exemplify key performance indicators?

Is Excel a Data Visualization Tool?

Excel is great for people performing data analysis but may miss the mark on providing data visualizations worth your time. Excel provides sufficient tooling to help you determine what type of charts or logic will work best when creating your data story. In fact, Excel (or any basic spreadsheet tool, such as Google Sheets) encourages their users to insert charts, pivot tables, or a power map for interactive graphing. With enough knowledge of how to work the program, the tool can create the needed visuals that may work well for your company.

However, creating these visuals en masse will prove to be a headache, and any company looking to consistently create visualizations from their big data would be better served looking to some of the popular free or open-source options available. Excel requires a bit more hand-holding, as you’ll first need to input data on the cell level, and then manually create the desired visualizations. Meanwhile, a data visualization tool will take your data and adjust your visualization in real-time.

When you consider the time investment needed to create a large number of visualizations in Excel, many realize there’s a benefit to considering one of the popular visualization tools on the market. Most will offer the ability to upload your data stored in Excel and create the graphs and charts you desire.


Free Data Visualization Tools

1 Google Charts

Google Charts provides easy to create visuals for whatever type of data you want. The application can provide visuals that are easily viewed in browsers or on mobile devices. They have a gallery of standard charts such as pie charts, line charts, column charts, area charts, treemaps, and more. Similar to the rest of Google’s “G Suite” productivity tools such as Google Sheets, their Charts application is absolutely free to use.

2 DataWrapper

DataWrapper provides a “pay what you need” model and provides their most basic version for free. The free version will let one user have access to create one map/chart a month, and allows up to 10,000 views/month. Like most free versions of paid products, this version will limit you in how many visualizations can be created and how many users can access your data. They also won’t let you export your visuals as a PNG or PDF file without a paid membership (starting at $39/month), making this most useful for start-ups and entrepreneurs.


Best Data Visualization Tools

1 Tableau

Tableau is a BI tool capable of creating interactive and sharable dashboards. This software routinely turns up when talking about top data visualization software due to it’s flexibility as an option for both small and large businesses. At it’s most basic level, Tableau can be learned and operated by users of Excel, but can also provide some of the most complex analytics for large corporations.

Price: Their Public version is free. Paid options start as low as $12/user/month.
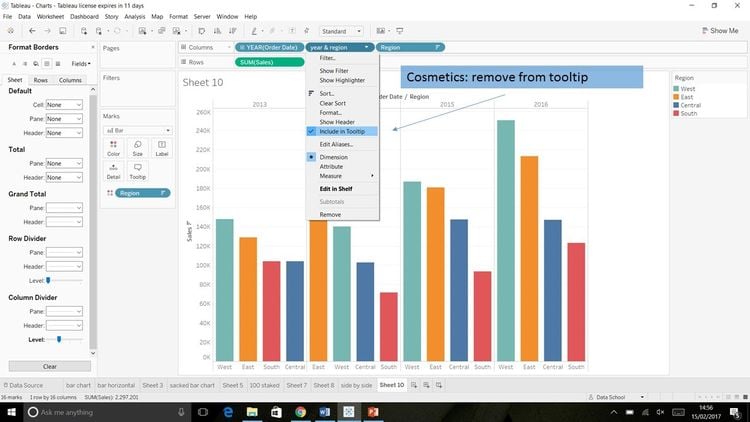
Tableau Bar Chart Data Visualization Tools
A bar chart in the creation process via Tableau.

2 Domo

Domo provides data visualizations depending on your role in the company or the specific industry you work in. Domo’s Card Builder functionality provides a drag and drop interface that lets employees of all backgrounds create powerful data visualizations and clearly and easily highlight key takeaways.

Price: Not provided by the developer. A Professional and Enterprise plan are available depending on the volume of rows required and any needed compliance.
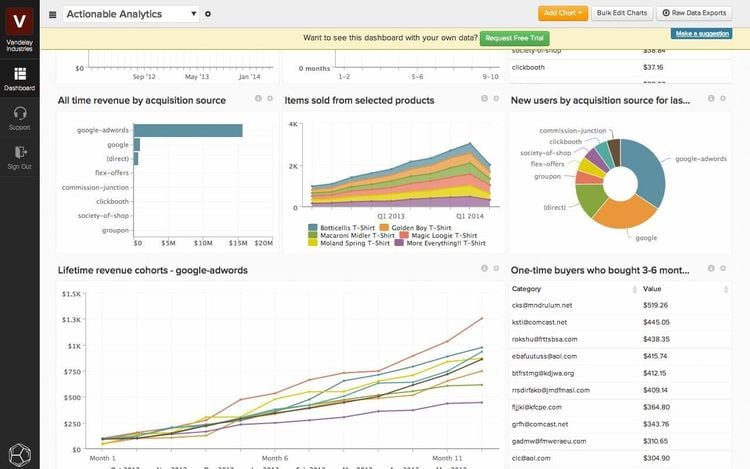
Data Visualization Tools In Domo Dashboard
A dashboard in Domo shows a number of data visualization possibilities.

3 Zoho Analytics

Zoho has its roots as a CRM software but also has powerful accounting, human resources, and business intelligence capabilities. Zoho Analytics is capable of turning your raw data into visuals that let you identify trends, outliers, and insights. It also has an assistant named Zia, which is an AI tool that uses machine learning and natural language processing technologies to help answer questions and make sense of your data.

Price: Starts at $22.50/month for the Basic package, providing access for 2 users, unlimited reports, and 500,000 rows (billed annually; $25/month otherwise)
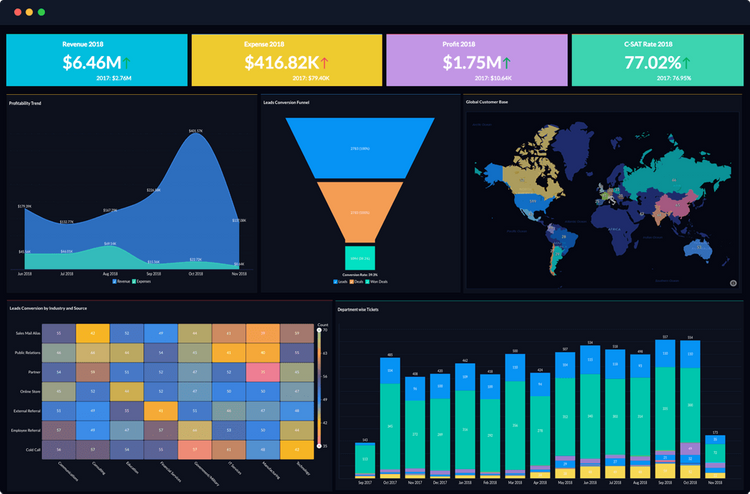
Zoho Analytics Dashboard Data Visualization Tools
An analytics dashboard in Zoho Analytics showing trends, funnels, mapping, and more.