The Best Big Data Analytics Tools

Get the best software for your business. Compare product reviews, pricing below.

Talk with a software advisor
Talk with an advisor
Get a free consultation from an independent expert.
Or, call toll-free: (800) 827-1151
Talk with a software advisor
Talk with an advisor

Popular Products

No products found
Arcadia Enterprise Screenshot

Arcadia Enterprise

Arcadia Enterprise is a native visual analytics and BI platform built for big data, and eliminates data movement out of your data platform to simplify the analytic lifecycle. The solution bridges the gap between self-service data visualization and advanced analytics. Architects and IT teams can keep data in their chosen platform and have access to granular raw data for deeper insights. Arcadia Enterprise is a complete analytics and BI platform that runs within your modern data platform, such as
Client OS
Windows, macOS, Web
Deployment
Cloud Hosted
TIBCO Spotfire Screenshot
TIBCO Spotfire is a business intelligence and data analytics software. The platform’s big data, content, predictive analytics features, and advanced collaboration tools make it a decent fit solution for medium to large enterprises. Spotfire also delivers machine learning capabilities and data discovery tools.
Price Range
   $     $     $     $     $   
   $     $     $     $     $   
Starting Price
$1,300/user/year
Client OS
Windows, macOS, iOS, Web
Deployment
Cloud or On-Premises
Periscope Data Screenshot

Periscope Data

Periscope Data was a data visualization and BI platform acquired by Sisense in 2019.
Price Range
   $     $     $     $     $   
   $     $     $     $     $   
Starting Price
$1,000/month
Client OS
Web
Deployment
Cloud Hosted
ClicData Screenshot

ClicData

★★★★★
★★★★★
(8)
ClicData is an end-to-end business intelligence platform that allows users to turn data from any source into actionable metrics. Centralize company data, KPIs and dashboards in one platform accessible from any browser and device. ClicData also enables collaboration by allowing users to publish and share customized dashboards and reports.
Price Range
   $     $     $     $     $   
   $     $     $     $     $   
Starting Price
$275/month
Client OS
Web
Deployment
Cloud Hosted
Qlik Sense Screenshot

Qlik Sense

Drive insight discovery with the data visualization app that anyone can use. With Qlik Sense, everyone in your organization can easily create flexible, interactive visualizations and make meaningful decisions. Support self-service visualizations, guided analytics apps and dashboards, embedded analytics and reporting—all within a governed framework that provides enterprise scalability you can trust. Features flexible license allocation, usage monitoring and an easy-to-use interface that saves
Deployment
Cloud or On-Premises
Tableau Screenshot

Tableau

★★★★★
★★★★★
(13)
Tableau is a business intelligence and data visualization tool. It excels in creating easy-to-understand visualizations from complex data, facilitating informed decision-making. Tableau’s user-friendly interface, with drag-and-drop capabilities, allows users with varying technical expertise to create dynamic, interactive reports and dashboards, enhancing data exploration and collaboration​
Price Range
   $     $     $     $     $   
   $     $     $     $     $   
Starting Price
$75/user/month
Client OS
Windows, Web
Deployment
Cloud or On-Premises
Google Looker Screenshot

Google Looker

Looker Business Intelligence is a cloud-hosted business intelligence software. [It was acquired by Google in 2019](https://techcrunch.com/2019/06/06/google-to-acquire-analytics-startup-looker-for-2-6-billion/). It combines with Google Cloud to provide customers with a multi-cloud analytics platform. Looker is known for its ease of use and collaboration features. It enables users with minimal SQL knowledge to create custom visualizations, dashboards, and reports. The platform supports a wide range of data sources and provides real-time data exploration capabilities.
Price Range
   $     $     $     $     $   
   $     $     $     $     $   
Starting Price
$5,000/month
Client OS
Windows
Deployment
Cloud Hosted
Domo Screenshot
Domo is a business intelligence and data visualization platform that excels in aggregating data from multiple sources into cohesive, visually appealing dashboards. Domo is designed to make data analytics accessible to all members of an organization via ease of use and a mobile app, promoting data-driven decision-making across various levels. Key features include extensive app connectivity, interactive and collaborative tools, and data manipulation capabilities.
Price Range
   $     $     $     $     $   
   $     $     $     $     $   
Starting Price
$83/month
Client OS
Web
Deployment
Cloud Hosted
Sisense Screenshot
Sisense, formerly Periscope Data, is a business intelligence tool offering data management and visualization capabilities. It provides ease of setup, connecting seamlessly to a wide variety of data formats and platforms. The software enables fast data alterations and updates, and its analytics platform, Sisense Fusion, uses AI and machine learning for data analysis.
Price Range
   $     $     $     $     $   
   $     $     $     $     $   
Starting Price
$4,200/user (perpetual license)
Client OS
Windows, Web
Deployment
Cloud or On-Premises
Microsoft Power BI Screenshot
Power BI from Microsoft is a suite of business analytics tools designed for data analysis and sharing insights. It offers a view of critical business metrics in real time, accessible on any device. Users can explore data with visualization tools and utilize over 50 connections to popular business applications and pre-built dashboards. The Power BI Mobile apps ensure that data and reports are always up-to-date and accessible from anywhere. It allows the combination of data from various sources, automatic data quality fixes, and the creation of reports with built-in and custom visuals. Power BI gateways connect SQL Server databases, A.I. models, and other data sources to Power BI dashboards. Additionally, Power BI reports and dashboards can be embedded into existing portals or applications for a unified experience using Power BI Embedded Analytics.
Price Range
   $     $     $     $     $   
   $     $     $     $     $   
Starting Price
Free
Client OS
Windows, iOS, Android, Web
Deployment
Cloud or On-Premises
Oracle Analytics Cloud Screenshot

Oracle Analytics Cloud

Scale insights across your organization with Oracle Analytics Cloud. This tool gives you self-service data visualization, data preparation, reporting, and business intelligence. Oracle Analytics Cloud lets you create scenarios to manage and handles what-if analysis for your business. Spend more time doing analytics and less time downloading data or putting two data sources together. Get the simple view you need to accomplish your job. Some features of Oracle Analytics Cloud include: Visual
Client OS
Web
Deployment
Cloud Hosted
Logi Symphony Screenshot
Logi Symphony, formerly Dundas BI, is a business intelligence and data visualization tool. It’s notable for its ability to easily build, design, and embed custom dashboards and other data visualization tools into applications. Logi Symphony is a self-service BI tool that allows developers to quickly clean and model data and create interactive dashboards. It can be accessed from anywhere as it can be deployed on-premise or through the cloud using AWS, Azure, and Google Cloud.
Price Range
   $     $     $     $     $   
   $     $     $     $     $   
Client OS
Windows, Web
Deployment
Cloud or On-Premises
Board Intelligent Planning Screenshot

Board Intelligent Planning

★★★★★
★★★★★
(2)
Board is designed to empower decision-making in various business contexts. It offers a unified platform for planning, predictive analytics, and business intelligence, enabling companies to leverage their data effectively. By providing a complete view of business information, Board helps organizations gain actionable insights and maintain control over their performance.
Price Range
   $     $     $     $     $   
   $     $     $     $     $   
Client OS
Windows, iOS, Android, Web
Deployment
Cloud or On-Premises
CALUMO Screenshot

CALUMO

CALUMO is a reporting, budgeting and forecasting application for accountants. With CALUMO, organizations can report, budget, forecast and plan their financial, sales, operations, manufacturing, projects, (the list is very long), easily and quickly. CALUMO comes as one complete product with no upselling because you hate that. CALUMO is one unified product, with all components from dashboards, reports, input templates, Excel, Word and PowerPoint integration, and ad-hoc analysis designed and coded
Price Range
   $     $     $     $     $   
   $     $     $     $     $   
Starting Price
$1,150/month
Client OS
Windows, Web
Deployment
Cloud Hosted
Yellowfin BI Screenshot

Yellowfin BI

Yellowfin BI is a business intelligence solution designed to streamline data-driven predictions and actionable insights from company performance. It offers an integrated reporting tool for in-depth insights and a complete BI stack with solutions like automated insights and collaboration tools. Yellowfin BI’s key strengths lie in visual data preparation, web-based ETL tools, and a storytelling feature for presenting data insights. Additionally, Yellowfin supports a range of data sources and offers customizable, interactive dashboards for real-time performance monitoring. It’s also equipped with a mobile app for on-the-go data tracking.
Client OS
Web
Deployment
Cloud Hosted
Datawrapper Screenshot

Datawrapper

★★★★★
★★★★★
(1)
Datawrapper is a data visualization tool that creates charts and maps for journalists, software developers, and other design professionals. Key features include importing data from various sources like Excel and Google Sheets, live-updating capabilities, and a wide selection of chart types and styles. The software supports various data import methods, including direct Excel and Google Sheets uploads.
Price Range
   $     $     $     $     $   
   $     $     $     $     $   
Starting Price
$599/month
Client OS
Web
Deployment
Cloud Hosted
Halo BI Screenshot

Halo BI

Enterprise intelligence and big data analytics built to leverage your most important investment your people We built the Halo Platform based on a few simple principles: Data isn’t “insight” or “information”, it’s just stuff. It’s only when that data is combined, processed and handed off to a real human being who can do something with it that it’s turned into something of value. As a result, the Halo Platform is built, not to impress folks with complexity, or gee-wiz gadgets, but to give regular
Client OS
Windows, Web
Deployment
Cloud Hosted
InterSystems IRIS Screenshot

InterSystems IRIS

InterSystems IRIS is a complete cloud-first data platform that includes a multi-model transactional data management engine, an application development platform, and interoperability engine, and an open analytics platform. InterSystems IRIS provides a set of APIs to operate with transactional persistent data simultaneously: key-value, relational, object, document, multidimensional. Data can be managed by SQL, Java, node.js, .NET, C++, Python, and native server-side ObjectScript language.
Client OS
Windows, macOS, Web
Deployment
Cloud or On-Premises
Esri Geospatial Cloud Screenshot

Esri Geospatial Cloud

Esri Geospatial Cloud helps you transform data into actionable insights. The solutions exposes patterns, relationships, anomalies, and incidents in massive amounts of data. The solution is open and interoperable—letting you integrate with the work and tools you already use. You’ll be able to add context to your data with maps, apps, and data layers. @youtube Data Engineering; Visualization and Exploration; Spatial Analysis; Machine Learning and Artificial Intelligence; Big Data Analytics;
Client OS
Web
Deployment
Cloud Hosted

We searched and searched, but we couldn’t find any products in our database that match your criteria. Perhaps our team of software experts can help? They’d be happy to provide a list of free the best big data analytics tools recommendations that meet your exact requirements.

Sort by 
Filter by User Rating
Filter by Price Range
Filter by Deployment
Filter by Client OS
LinkedIn
Buyer’s Guide

Big data is where the data volume, acquisition velocity, or data representation requires the use of significant scaling for efficient processing. Big data generally means you’re working with larger volumes, a higher velocity, and a great variety. Can you harness the data that is out there to deliver the value proposition for your business?

Find out if big data analytics tools are right for your operation:

What Are Big Data Analytics Tools?

Big data analytics tools let end-users analyze huge volumes of transactional data and other sources that may be left otherwise untapped by conventional business intelligence programs. This is accomplished through data processing, data modeling, data mining, online analytics processing, ultimately helping to create insights, visualizations, dashboards, and reports your business can act upon.

Big data itself is a concept that facilitates the handling of a large volume of data sets. These datasets will be used to serve the business they belong to by helping set goals for the operations. Whether in the cloud or on-premise, these analytics platforms provide the self-service tools you need to dig deeper into your organization.

Big data analytics tools are used by any organization that outgrows simple databases or other data handling architectures. A good example of a simple database is data that can be expressed or handled well in a traditional spreadsheet program such as Excel. Big data tools include non-relational databases (NoSQL), relational parallel processing databases, and big data frameworks/ecosystems.
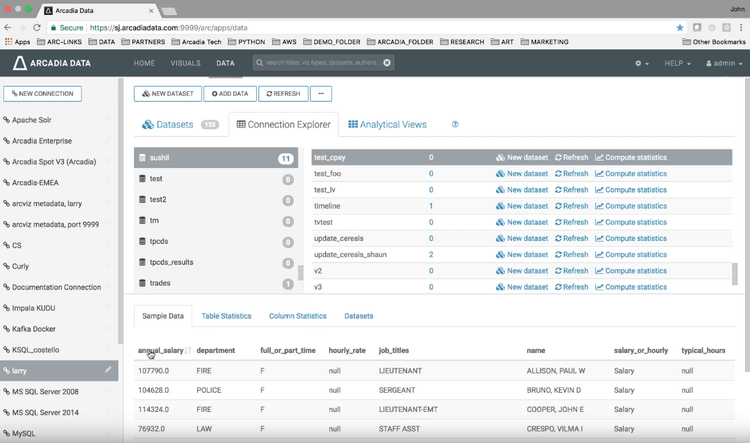
Arcadia Data Data Sets Big Data Analytics Tools
Arcadia Data provides easy access to your data sets.

Features of Big Data Analytics Tools

  • Data processing: Collects and organizes raw data preparation for eventual use by reformating it into similar and usable data sources. Includes data modeling and data mining.
  • Online analytics processing (OLAP): OLAP’s perform a multidimensional analysis of business data. They allow companies to conduct complex calculations, evaluate trends, and work with data modeling.
  • Predictive analytics: Uses historical data sources to predict what will happen in the future. Examples in everyday business include identifying customers to upgrade/remove services and focusing marketing campaigns on the right targets
  • Statistical analytics: Analyzes data that is made up of numbers for the purpose of analyzing risk or future decision-making
  • Data Visualizations: Patterns, trends, and correlations that place data into a visual context to help people understand. Creates a visual means of enabling rapid consumption of key business data, primarily in the forms of charts, graphs, and plots.
  • Dashboards: A visualization tool that displays the current status of metrics and KPIs for your business, based on your preferences (what numbers to show, what metrics to display, etc.)
  • Reporting: Create reports that let you view trends pertaining to company financials, sales, marketing, human capital management, and more.
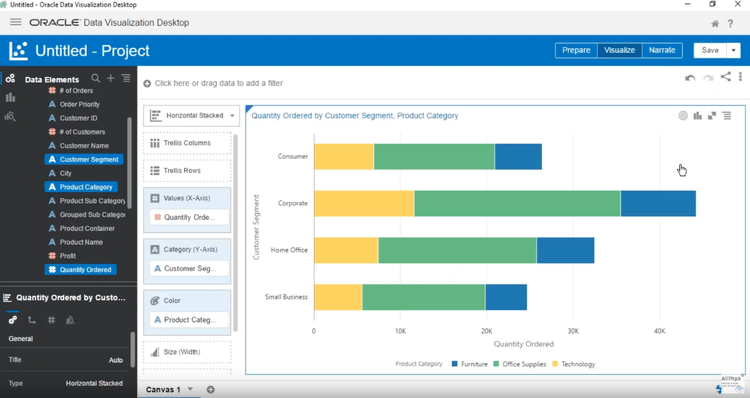
Oracle Analytics Cloud Project Creation Big Data Analytics Tools
Oracle Analytics Cloud turns your project data into a data visualization.

Benefits of Big Data Analytics Tools

Big data analytics tools can be of use to any business with a large volume of data that lacks the capability to sift through and understand what it means for their business. Some of the top benefits of big data tools include:

New Product Ideas

Knowing how your customer’s feel about your products and services, or how satisfied they may feel if you created a new product can help your company sustain customers while continuing to add more consistently. This process is called NPD, or new product development.

Some new product development steps include the process of idea generation, idea screening, and idea development/testing. From there, an organization must conduct market testing, work through implementation processes, and determine a price for the product.

Benefits of using big data in new product development include:

  • Creating products that consumers can connect with or relate to
  • Increase the value of the product
  • Minimize risks in the development process
  • Forecast the performance of the products
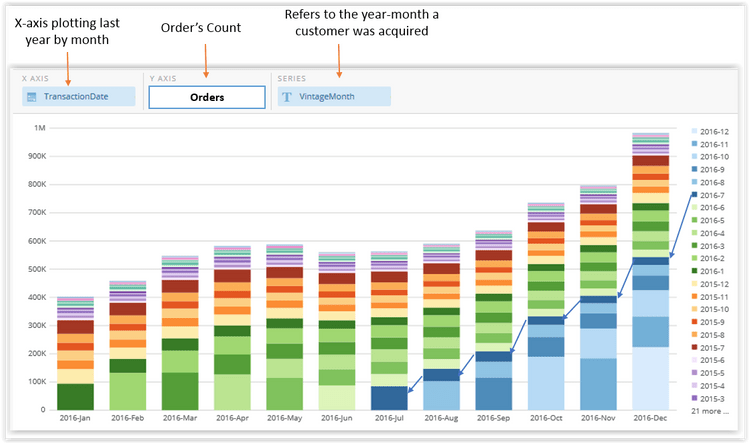
Domo Order Graph Big Data Analtyics Tools
Domo lets you forecast the performance of a product based on historical metrics.

Identify More Efficient Ways of Doing Business

Storing a lot of data can be costly. Some big data storage and processing frameworks such as Hadoop can assist you in storing a great deal of data (more on that below). There is also predictive analytics which data scientists can use to predict the success of new products.

Predictive analytics can let users suggest that the business continues on the path their on or pivot to a more efficient method of doing things. These suggestions are usually based on historical sales, but can also be based on internal capacity, online conversion rates for related products, sales forecasts, and an analysis of other new product launches.
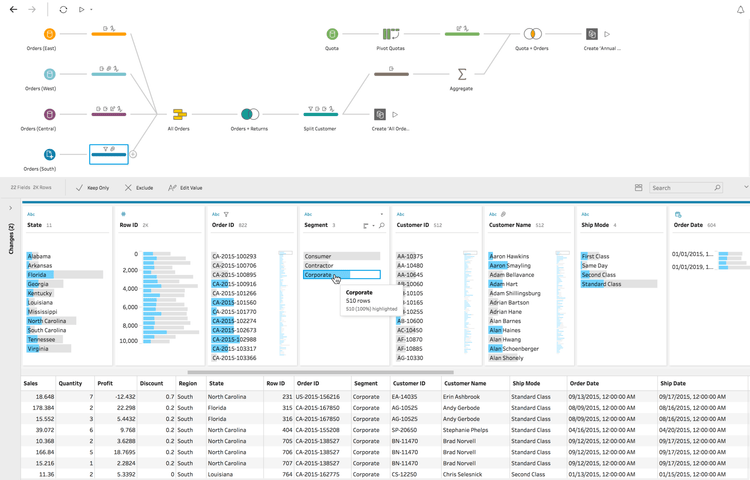
Tableau Prep Builder Big Data Analytics Tools
The prep builder in Tableau.

Make Faster and Better Decisions

An efficient big data analytics tool will provide you with the increased speed needed to analyze sources of data and ultimately make decisions based on what you’ve learned from this data.

For example, your business may want to gather metrics that will improve customer loyalty and satisfaction, with the end goal of keeping current customers active and not moving to another product/service. Big data analytics software can help you decide what sort of personalization experience to give your customers, such as recommended or personalized product and service suggestions based on their historical use, their previous purchases, the frequency they purchase these products/services, etc.

This is just one of the many examples of putting real-time data to work, which can help increase customer engagement. Customer service can be a very important deciding factor for many to choose to continue business with your company, and data analytics help improve your efficiency at providing this service.
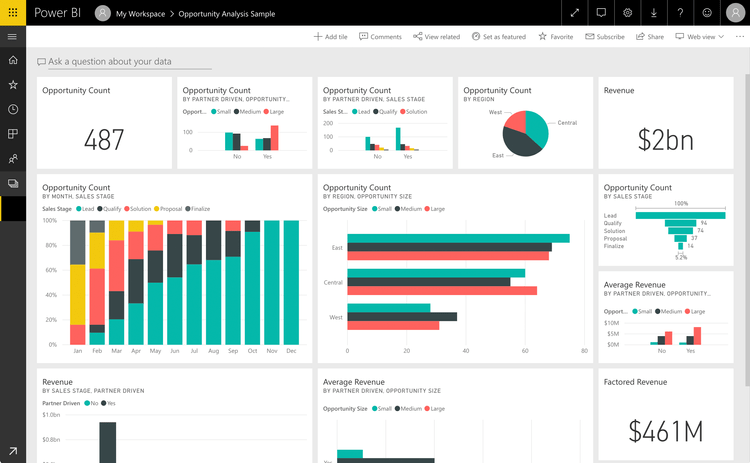
Microsoft Power BI Opportunity Analysis Dashboard Big Data Analytics Tools
The opportunity dashboard of Microsoft Power BI lets you have an overview of your operations.

Big Data Analytics and Machine Learning

Machine learning is the scientific study of algorithms and statistical models with computer systems to perform tasks without using instructions, but instead relying on patterns and inference. @:Daniel Faggella, CEO at Emerj

Machine learning is a form of AI that lets a system learn from data. One famous example is IBM Watson, which is a computer system capable of answering questions posed in natural language.

In big data analytics, machine learning is the processor while big data is the data that’s being fed into the processor or analytical system. Machine learning will then help learn or improve upon its predictions using the data fed into it. In short, machine learning provides extensive calculations done over datasets which creates a learning model. As data file sizes continue to grow, there is larger importance on implementing a distributed computing method with big data analytics solutions.

A great example of the use of big data with machine learning is when it comes to preventative maintenance in a manufacturing plant. Big data can be gathered from the machinery sensors that can help the machine test specific models. If the temperature of a machine seems off, perhaps a replacement part is needed. A maintenance team can also be alerted to address the situation at the earliest available moment.

Business Intelligence Software vs Big Data Analytics Tools

Some may consider business intelligence systems and big data analytics tools to be relatively the same thing. They may argue that BI tools and big data analytics software are merely synonyms of one another. While they do provide very similar types of functionalities, the systems can provide a different set of results.

Business Intelligence Software

Business intelligence (BI) is more of an umbrella term that includes big data, data analytics, reporting tools, data visualization, and other tools and systems that make use of historical data. BI tools vendors are always looking for ways to improve their solutions to give the end-user all that they need to learn about their data and make better decisions.

Big Data Analytics Tools

Big data analytics tools can mean different things to different people. To some, it’s a business intelligence software that deals with a larger volume of data. To others, it is a specific type of approach to analytics or focuses on a specific area such as marketing or customer insights. What most can agree on is that big data is found within the overall practice of business intelligence.

What’s The Difference?

Business intelligence software encompasses all types of data analytics and reporting tools that help a business make better decisions. Big data analytics tools help determine the relationship between different sets of data and ultimately create insights. Big data analytics tools will typically be used to process larger volumes of or more complex sets of data. Most BI tools will be sold in various tiers that allow for add-os for “big data capabilities”.

Data Storage and Processing Frameworks

As Big Data defines a data set that is large and complex, businesses will equally need a large and complex framework they can rely on to store their data (data warehouse) and handle batch processing (data management).

One example of a framework is Apache Hadoop, an open-source software project that enables the distributed processing of large data sets across clusters of servers. These data sets include information from corporate systems (ERP and CRM software), external data, social media data, and more. It’s designed to scale up from a single server to thousands of machines, with a very high degree of fault tolerance.

Hadoop is both a framework and an ecosystem application rather than a database, which lets you store and process a large volume of data. It can also handle the complexity of handling volume, velocity, and a variety of data.

Integrating Hadoop into your BI architecture has the following benefits:

  • Low-cost data storage
  • Highly scalable
  • Structured, semi-structured and unstructured data
  • Batch oriented query processing