The Best Project Management Software
We’ve reviewed the top project management software for various industries, from IT teams to construction and professional service firms. These solutions can help your business stay on budget and increase team collaboration.
- Adheres to regional labor laws for global teams
- Mobile app for time tracking and project management
- Offers API access and integrates with Slack, Jira and Teams
- Billing, time and expenses tracking by project phase
- Employees can input time entry from anywhere
- Great for project management

- Automates emails, document sharing, and photo archiving
- Customizable reporting
- Integration with AutoCAD and Revit
Project management software helps teams plan, organize, track, and collaborate on projects by enabling features like task management, resource allocation, scheduling, file sharing, communication tools, reporting, and data visualization. We used our review methodology to review and rank our favorites.
- Deltek Replicon: Best for Time and Expense Management
- BQE CORE: Best for Architecture and Engineering
- Procore: Best for Construction
- Trello: Most Simple UI
- Asana: Best for Remote and Hybrid Teams
- BigTime: Best Project and Time-Tracking Capabilities
- Smartsheet: Best for Healthcare Organizations
- Jira: Best for IT Teams
- ClickUp: Best Free Option
- Wrike: Best for Professional Service Teams
- Monday.com: Best for Small Companies with Multiple Teams
- Zoho Projects: Best for Educational Facilities
Deltek Replicon - Best for Time and Expense Management
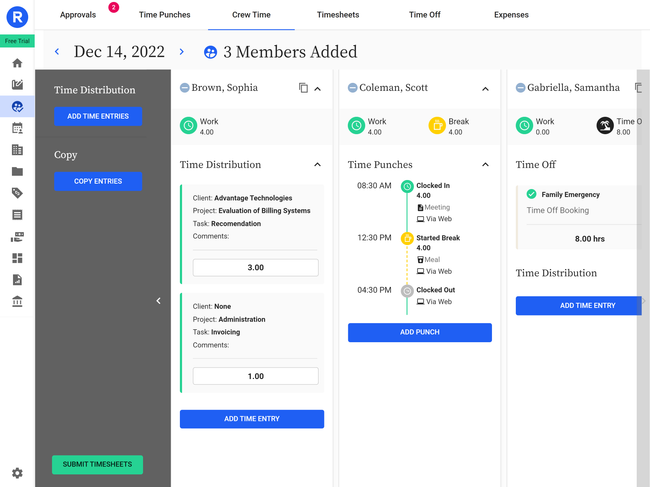
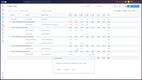
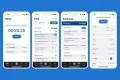
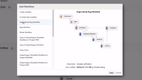
Deltek Replicon helps professional service companies manage complex time and expenses across all departments. The flexible timesheet tool lets employees accurately track hours while working on different projects. For on-the-go consultants or developers, the mobile app allows them to record hours spent on every task from any location. This helps boost accuracy by logging hours instantly instead of relying on memory when filling out their timesheets days later.

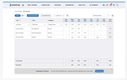
Additionally, Replicon includes billable hours logging for each project for more accurate client billing. Timesheets have configurable billing dropdowns, so you can quickly select the applicable rate for the specific client, project, or task. Managers can also use the built-in compliance engine and approval workflows to ensure the accuracy of every timesheet and invoice.
Deltek Replicon integrates with several leading ERP, accounting, CRM, and business management platforms to create integrated processes. The project time tracking suite starts at $12/month, making it a great option for midsize professional service firms and remote teams.


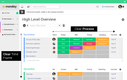
BQE CORE - Best for Architecture and Engineering
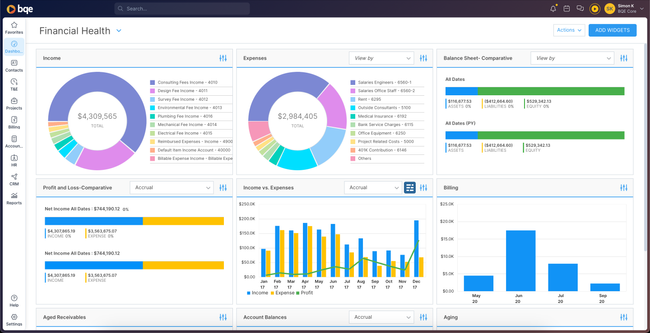
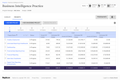
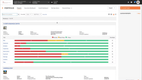
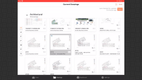
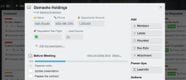
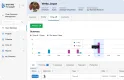
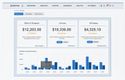
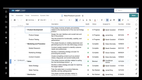
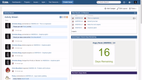
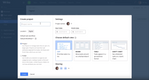
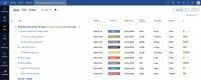
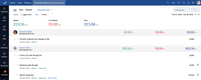
BQE CORE’s project center tool gives architecture and engineering (A/E) PMs more control of an ongoing project. On one screen, you can quickly see KPIs like unbilled time and the project timeline in a Gantt chart view. Scroll down to view a project analysis graph that shows the budget vs. total costs. This tool consolidates all the project data into one place without cluttering the interface, which is great for PMs who often struggle to track progress using disconnected systems or modules.
The project center tool is also completely interactive, so you can drill into data to spot trends or detect anomalies. The right taskbar gives you access to all the project documents, including drawings, submittals, RFIs, and general notes. You can check the estimated budget vs. actuals or ensure the timeline aligns with the contract. A/E firms can adjust schedules or expenses by accessing granular data to ensure profitability.

BQE CORE’s base package includes the full project center, billing, invoicing, and time and expense features. Unlike most project management software, the platform has optional accounting, CRM, and HR modules if you want an all-in-one solution.
Procore - Best for Construction
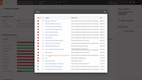
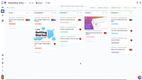
Procore is built with industry-specific features that cater to construction businesses. Procore is designed specifically as a construction management platform, covering an entire project lifecycle from preconstruction to closeout.
Additionally, Procore offers project management tools tailored for construction, such as RFI submittal tracking, document management, daily logs, and scheduling capabilities like Gantt charts. These tools help increase visibility and ensure that projects stay on task. Procore also has a quality & safety module that helps contractors protect workers, monitor safety protocols, and track issues on construction sites.
This software also offers an open API and app marketplace with over 500 integrations, so firms can connect Procore with any other tools they use, such as CRM, BIM tools, and estimation applications like ProEst. The one drawback of Procore is that some reviewers mentioned a steep learning curve for the software.
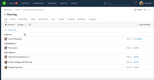
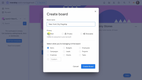
Trello - Most Simple UI
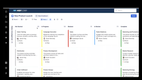
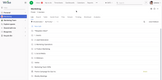
Trello includes strong customization features, templates, and cost-effective pricing. Its custom boards, lists, and cards are tailored to a company’s specific project needs, making it suitable for various team sizes and industries. Also, it provides a wide range of pre-built templates for different project types, saving both effort and time in setting up boards. Its automation capabilities through unlimited power-ups and integrations help increase productivity and streamline workflows.
We also like that Trello is easy to use and has a user-friendly interface. Its simple design makes it easy for teams of all sizes to adopt and learn quickly, minimizing the steep learning curve of many other software. Teams can use its multiple features, such as comments, attachments, due dates, and assignments, to enable effective teamwork.
Trello offers a generous free plan for teams with essential project management features, making it a cost-effective solution for small teams. Paid plans are also reasonably priced for larger teams, starting at $5/month/user billed annually. However, one downfall we found with Trello is that it only provides a Kanban board view, while other project management tools offer additional ones like Gantt charts or calendars.
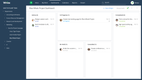
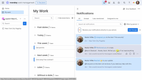
Asana - Best for Remote and Hybrid Teams
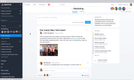
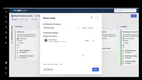
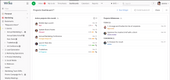
Asana is best for remote and hybrid teams because of its strong centralized collaborative platform and visual interface. This software allows team members to share files, leave comments, and update project progress regardless of location. Asana’s visual interface has features like project timelines, task dependencies, and Kanban boards to help remote teams see their task timelines and project workflows clearly.
We appreciate its integration capabilities with various apps and tools such as Google Drive, Slack, and Dropbox. This integration promotes seamless collaboration and document sharing between team members. Asana also provides a mobile app, making it easy for team members to view messages and update tasks while on the go.
However, one drawback we discovered with Asana is that it lacks time-tracking features on a basic plan, making it difficult to monitor productivity. However, the Advanced plan has built-in time tracking for $24.99 per user per month, billed annually.
BigTime - Best Project and Time-Tracking Capabilities
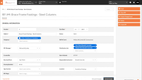
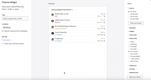
BigTime allows companies to centralize their project data, and set up budgets, schedules, and scopes to provide full visibility into a project’s progress. This ensures better control over project deadlines, budgets, and profitability.
We like that BigTime has strong time-tracking tools. Employees can easily log expenses and hours against client projects, enabling accurate billing and cost management. This PSA tool integrates with popular accounting software like QuickBooks, enabling easy transfer of billable data.
BigTime also has timesheet restrictions, audit trail protections, and DCAA compliance, making it suitable for government contractors and projects. One weakness we discovered with BigTime is that new users find the software difficult to navigate, which could present a bit of a learning curve to new users.
Smartsheet - Best for Healthcare Organizations
Due to its secure management, customizable platform, and integration capabilities, Smartsheet is a suitable project management tool for healthcare organizations. We like that Smartsheet meets healthcare industry standards like HIPAA, GxP, and GDPR. This ensures that healthcare professionals can securely access and share PHI while ensuring compliance and data governance.
The software also provides pre-built templates for healthcare professionals, such as health screening, PPE inventory tracking, and safety management. Smartsheet can integrate with many healthcare systems, such as Veeva, Epic, and Microsoft 365. However, one drawback we found is that Smartsheet’s messaging functionality imposes character, column, and cell limits on automated workflow alerts and requests. This could be a potential issue for teams dealing with large amounts of data or lengthy messages.
Jira - Best for IT Teams
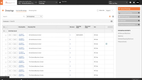
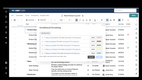
We picked Jira due to its comprehensive issue, task tracking, and project management capabilities. Jira was originally designed for agile software development teams, making it well-suited for IT projects. The software has features like sprint planning, backlog management, Scrum boards, and agile reporting. Its features also offer visibility into team workloads, project progress, and potential bottlenecks.
Jira excels at tracking issues, tasks, bugs, and requirements, which are crucial for IT projects and operations. It also integrates with many tools, such as version control systems like Git and communication tools like Slack or Zoom.
Since Jira has an extensive set of features and customization options, familiarizing yourself with the platform may involve a steep learning curve. Jira also has no built-in timeline view to track overall project progress, making users rely on third-party apps.
ClickUp - Best Free Option
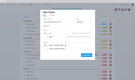
ClickUp is a great project management software option for start-ups or smaller teams that want to test a system risk-free. The software offers a forever-free plan for unlimited users and provides 11 different task views, such as boards, calendars, and Gantt charts.
We like that ClickUp is an all-in-one platform for teams, combining features for team collaboration, scheduling, project planning, and task management. This eliminates the need for multiple tools and makes teams work more efficiently by having everything in one centralized location. ClickUp also offers strong communication tools like mentions, file sharing, comments, and a built-in chat view.
However, one drawback with ClickUp is that although it offers time-tracking capabilities, they are limited due to basic analytics, a complex interface, and mobile app challenges. Some users integrate ClickUp with additional tools like Everhour to access advanced features like invoicing and project budgeting.
Wrike - Best for Professional Service Teams
We included Wrike because of its comprehensive feature set tailored to professional services such as consulting firms, advertising agencies, and legal services. Wrike provides built-in tracking features that allow professional service teams to monitor budgets and accurately track billable hours spent on their client’s projects. The software also integrates with QuickBooks to sync for billing and invoicing purposes.
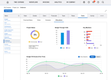
We also like that Wrike offers real-time reporting and analytic capabilities through custom dashboards users can create with widgets. These widgets include ‘my tasks’, overdue tasks, calendars, pending file reviews, and an activity stream. This software also provides capabilities like drag-and-drop resource allocation, workload balancing, and capacity planning. These allow firms to organize and optimize their resources to take on more clients.
However, we don’t believe Wrike is the best option for small teams. While Wrike offers a free plan, its features are limited, and the higher-priced premium plans may be costly for teams with limited budgets. The Team plan starts at $9.80 per user per month, however, the more popular plans like Business start at $24.80 per user per month.

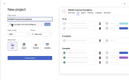
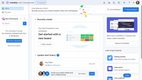
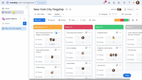
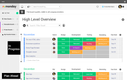
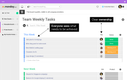
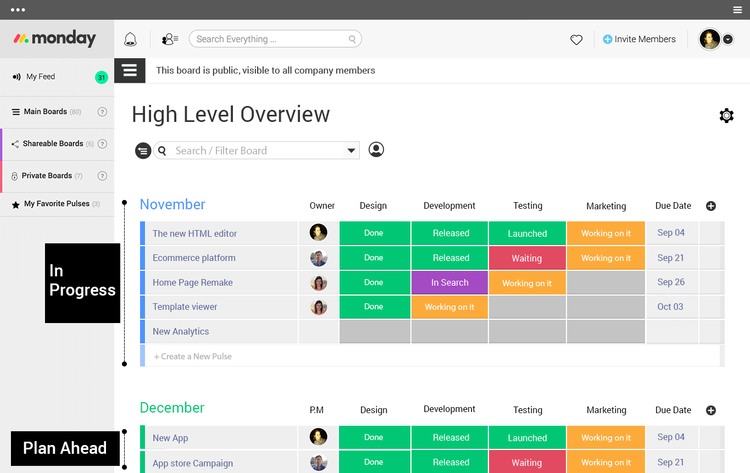
Monday.com - Best for Small Companies with Multiple Teams
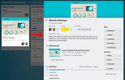
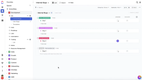
Due to its customizable platform and collaboration tools, we found Monday.com to be a suitable choice for small companies with multiple teams. Monday.com provides a customizable platform with over 200 templates. These templates allow teams to create custom workflows, views, and dashboards personalized to their needs. Using the numerous widgets Monday.com offers, teams can use timeline and calendar widgets for schedules, number widgets for KPIs and map widgets for location-based data. This software also offers strong communication tools like file sharing, comments, real-time updates, and integrations with apps like Microsoft Teams, facilitating seamless teamwork and alignment across numerous teams.
We also like that Monday.com provides automation capabilities to help smaller businesses streamline workflows and reduce manual tasks. These automation tools and integrations can improve productivity among every team within the organization. Monday.com offers a forever-free plan for up to two seats. However, some smaller, start-up companies might find the basic price a bit expensive, starting at $9 per seat per month.
Zoho Projects - Best for Educational Facilities
We believe Zoho Projects is best suited for educational facilities due to its University Outreach Program and collaboration tools. The University Outreach Program gives free access to the Enterprise edition of Zoho Projects for educational institutions. This program aims to empower professors and their students with practical experience in using a project management tool, preparing them for real-world business settings.
This software provides features like file sharing, real-time updates, and integrations with Zoho Cliq that can enhance collaboration and communication. We also like that Zoho Projects offers various reporting capabilities, such as task, issue, and timesheet reports. These features can give educational institutions insights into project progress and performance metrics, enabling data-driven decision-making.
However, one drawback we found with Zoho Projects is that it does not mention integrating with grading software.
What is Project Management Software?
Project management software is a digital tool that helps managers organize, plan, and oversee projects from start to finish. This software provides features like task assignment and tracking, resource allocation, scheduling, reporting, and collaborative document sharing.
Also known as PM software, these solutions help project managers across every industry, from software development to construction, to increase customer satisfaction through decreased project cycle times and better deadline projection accuracy.
Key Features
- Project Planning and Scheduling: Design policies and methods to achieve project lifecycle objectives. Assign tasks to complete projects by allocating resources within a set timeframe shown in a custom calendar view.
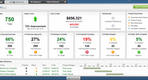
- Progress Tracking: Quickly identify where a project is relative to scheduled completion. Task completion dashboards display a percentage to completion, as well as provide filtering capabilities to identify what work remains.
- Team Collaboration: Allow two or more users to collaborate on the same project, seeing updates and edits to files in real time. Coordinate between tasks and subtasks.
- Time Tracking: Track hours spent on individual tasks and the project as a whole with custom timesheets. Monitor billable versus non-billable hours for improved budgeting.
- Reporting: Create summary overviews of the current status of a project viewable by the entire team or select members. Custom reports cover status, risk, variance, and boards like Gantt and PERT charts. Budgeting: Estimate the total cost of a project, accounting for labor, material procurement, and operating costs.
- Billing and Invoicing: Prepare and send out client invoices, maintain cash flow, and measure project profitability through planning, execution, and analysis.
- Resource Allocation: View resource (labor and equipment) availability. Connect with your scheduling functionality and mirror labor scheduling in terms of the usage of resource registers and availability schedules.
- Document Management: Manage shared access to common documents with multiple file format support, editing permissions, and audit trails identifying change histories.
- Change Management: Manage change orders through a structured approval process to ensure that the changes support the interests of the project stakeholders.
- Project Scope: Outline a detailed plan for your project. Use collaboration tools, form-based project templates, and access to scope statements from previous projects to better assist project authors.
Types of Project Management Methods
Some of the most popular project management methods include:
- Waterfall
- Scrum
- Agile
- Lean
- Kanban
- Six Sigma
Project management software includes the tools necessary to incorporate one or more of these popular methodologies into your system.
Types of Project Views
Flexible project views can help ensure your project management software presents information to you in a manner that is easy to digest in a highly visual manner. The most popular types of project views to track progress include:
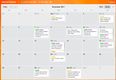
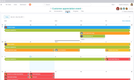
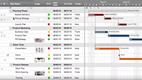
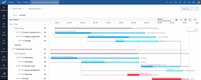
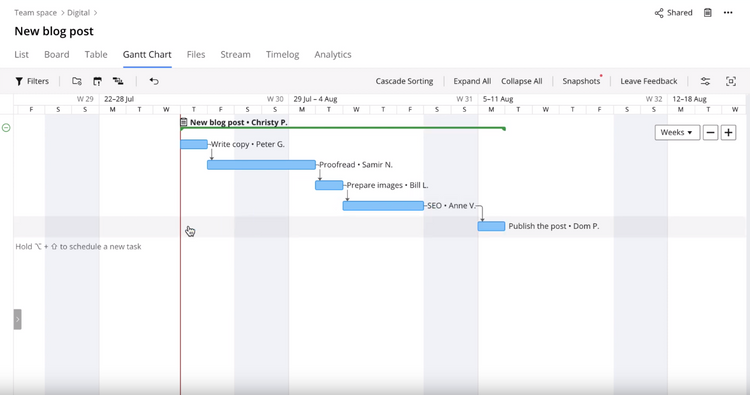
Gantt Charts
A Gantt chart is a bar chart that shows project schedules and their overlapping relationships between activities. This visual view of project tasks lets you and your staff see what work is scheduled at varying times. It’s best used to discover which employees can complete tasks to avoid interrupting the project workflow.
Gantt charts show start and end dates, details about the tasks that need to be completed, the length of each task, and who has been assigned the task. Gantt chart capabilities help in project planning by creating task dependencies, adding checkpoints or milestones, or showing management which employees are completing their tasks on time.
Task Lists
Task lists are sortable fields (similar to your common spreadsheet) with rows and columns for employees, tasks, due dates, progress, and priority levels. They can be thought of as to-do lists assigned to your staff to ensure the project is completed on time.
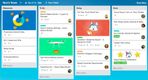
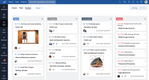
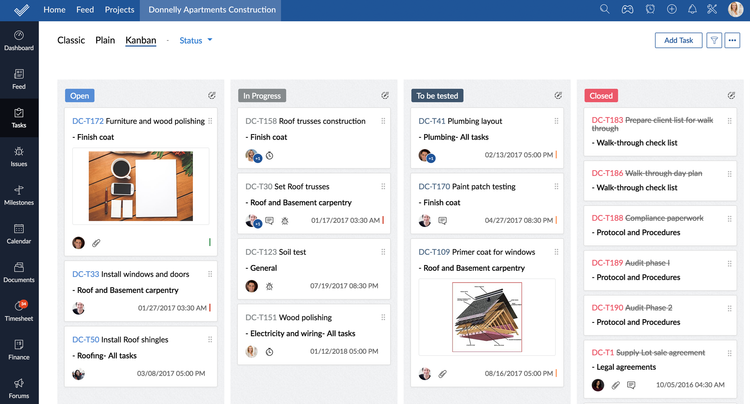
Kanban Boards
A Kanban board is another way to visualize project tasks through cards and columns. Each card or column represents a different project stage, providing an easy way to see which work needs to be completed versus the ones in progress.
Kanban boards can be broken down to show work-in-progress limits, commitment, and delivery points. The cards allow teams to write their work and tasks and create their overall project workflow. From there, each card will be arranged into workflows (columns) that lay an intuitive path to completion. Kanban boards will let you establish work-in-progress limits, which are simply a cap on how many cards can be in one column at a given time.
Pricing Guide
The cost of project management software ranges from $4 per user per month to $75 per user per month. Many solutions offer free trials to help you determine which level you need. Some development companies also offer a forever free version of their project management software.
The cost of project management software will depend on the number of users, the functionalities needed, and the scope of your business.