Best Business Intelligence Tools

- Starts at $10/user/month
- High-impact, visual data summaries
- Similar interface to MS Word and Outlook
- Self service capabilities
- Dynamic reporting and dashboards
- Data modeling, ETL, and ad-hoc analysis features
- Great for medium to large scale companies
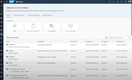
- Easily drill down into transactions and customer data
- User-friendly and advanced reporting
We recommend the best products through our own independent review process.
BI Tools (or business intelligence software) are designed to help key decision makers make informed decisions by pulling financial and non-financial data directly from ERP systems. BI tools transform this data into powerful analytics and reports.
To help you choose the best solution to integrate with your existing system, we evaluated a few of the most popular options on the market. We determined that the best software should have features like online analytical processing (OLAP), big data, key performance indicators (KPIs), and data integration. From our research of over 20 options, we’ve compiled a list of the best BI Tools software.
- Microsoft Power BI: Best Overall
- Oracle Business Intelligence: Great Financial Reporting
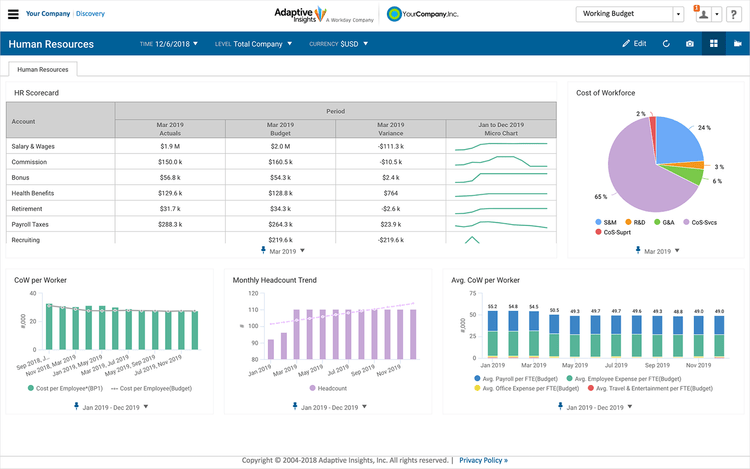
- Adaptive Insights: Top Cloud Solution
- SAP Analytics Cloud: Best Cloud BI
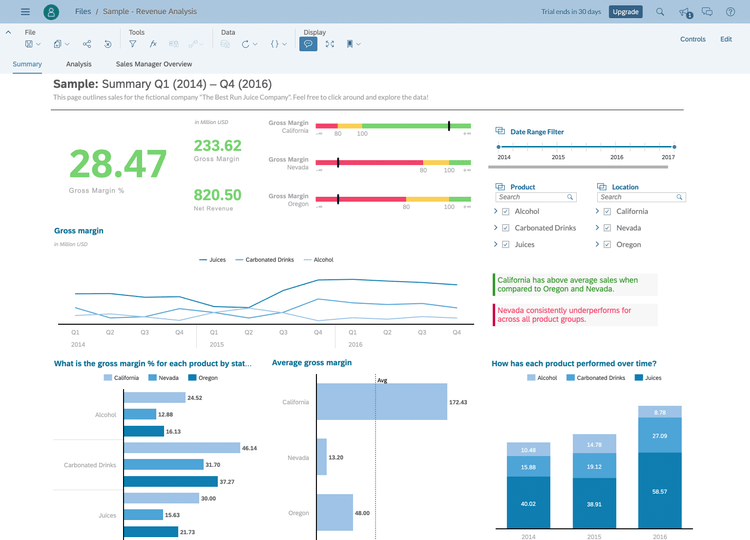
- Tableau: Best for Multiple Data Sources
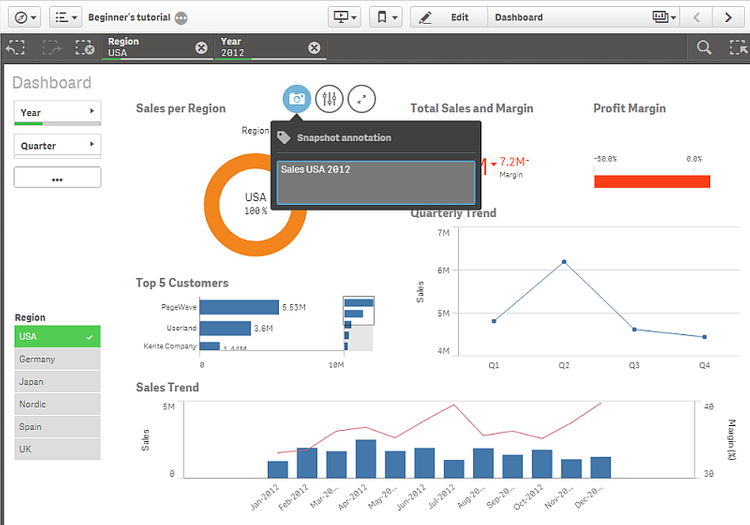
- QlikView: Best Free Cloud-Based System
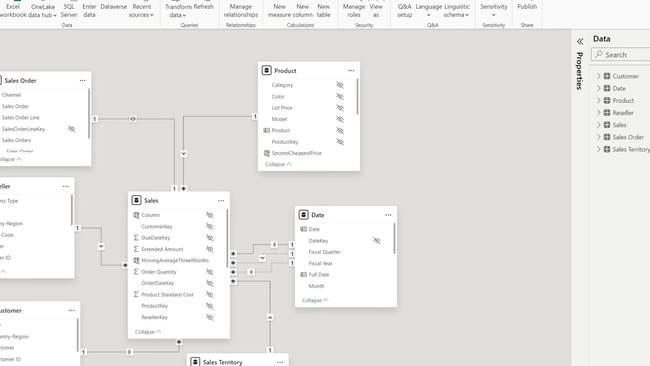
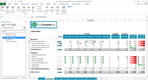
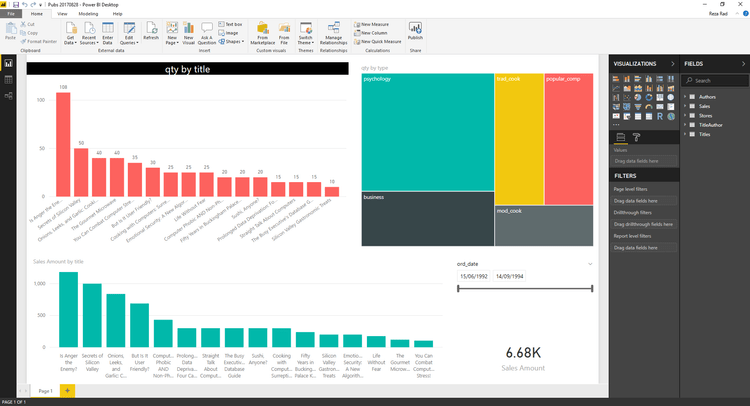
1 Microsoft Power BI - Best Overall
The flagship Microsoft Power BI tool is available at no cost and can be downloaded straight from the Microsoft Store. The free license will enable only some of the features of Power BI, such as a connection with 70+ data sources, the ability to publish to the web, and the ability to export to platforms such as PowerPoint and Excel. This version is great for doing your own analysis, as long as you don’t need to share that analysis with any other end users (which is a feature of the Pro version).

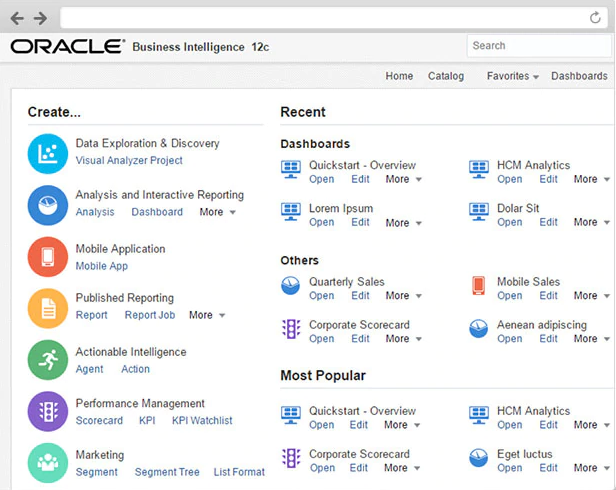
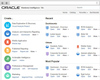
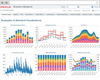
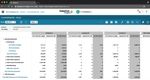
2 Oracle Business Intelligence - Great Financial Reporting
Oracle Business Intelligence 12c solution provides visual analytics to let any department in your organization make better decisions. They market themselves as having a modern analytics platform, advanced analytics capabilities, data visualizations, mobile access, and self service capabilities.
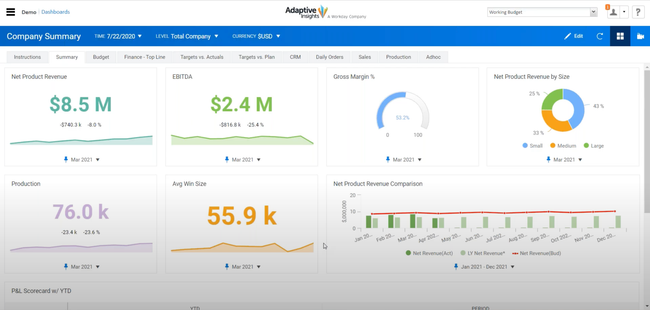
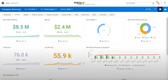
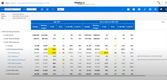
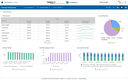
3 Adaptive Insights - Top Cloud Solution
Adaptive Insights markets itself as a corporate performance management (CPM) tool to provide business planning and analytics on an increased scale. The software is cloud-based and is intended for use by larger enterprises. Adaptive Insights provides standard reporting features as well as data discovery, visualizations, and versions available for your most important departments of Finance, Sales, and Workforce Planning.
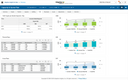
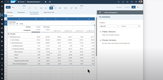
4 SAP Analytics Cloud - Best Cloud BI
SAP Analytics Cloud is well known for their ERP solutions such as SAP Business One. They are also a leader when it comes to data analytics and visualization. Their cloud BI software uses the power of SAP HANA in-memory computing to provide real-time SaaS business intelligence.

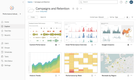
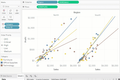
5 Tableau - Best for Multiple Data Sources
Tableau has a lot of great features which make it easy to share data across interactive dashboards. Involve your entire team or organization in decision making for better results. Embedded analytics are scalable to match your business needs.
6 QlikView - Best Free Cloud-Based System
QlikView is a free cloud BI intended for use by individuals. Both the Desktop and the Cloud Basic version have fully interactive apps, sharing capabilities (up to 5 users), and free access to the Qlik DataMarket. QlikView has a Personal Edition that offers unlimited access (not a trial product) for user-driven exploration and analysis.
What Are BI Tools?
Business intelligence software, also known as BI tools, are designed to gather and sort historical data, create engaging visuals, then help you analyze and report your findings. Business intelligence software is geared toward providing in-depth data visualization to higher levels of management. This gives key decision makers the ability to make better decisions based on relevant business data pulled from their ERP systems, rather than on instinct. Machine learning applications further aid data analysts in visualizing actionable insights.
What sets business intelligence software apart from standard reporting is the ability to report on financial and non-financial data sources alike. Each data set can be customized to your business needs. You can now see the time it takes to produce each product, how many parts and materials are needed, how many were produced per hour by each employee, etc. The more independent data sets you have, the better performance overview you’ll get.
Information gathered allows users to make informed decisions going forward such as: Do we hire more employees? Can we afford to take on a new customer that will double the output? Will a new machine speed up the processes and efficiencies of the manufacturing process?

Features of BI Tools
Successful companies are always planning, analyzing and reporting on practical activities in order to top out efficiency, lower expenses and gain greater market share. The following applications can be a part of any business intelligence software and help you achieve results:
Online Analytical Processing (OLAP)
OLAP’s perform a multidimensional analysis of business data. They allow companies to conduct complex calculations, evaluate trends, and work with data modeling to forecast future events.
Big Data
Big Data is another way of referring to a large data set. Big Data can be analyzed via computer software to reveal patterns, trends, and associations.
Key Performance Indicators (KPI’s)
A KPI is a business metric which has been deemed particularly useful in reflecting the achievement of an important business outcome.
These are commonly used by organizations to evaluate the success of a particular activity in which it is engaged. These assessments often lead to the identification of potential improvements. It’s the inclusion of the modifier “key” that matters most when it comes to qualifying for KPI status.
The stages in identifying KPI’s include:
- Having a pre-defined business process. Without a predefined business process, you don’t have measurable data.
- Recognizing the requirements for the business processes;
- Creating a quantitative/qualitative measurement of the results and comparison with set goals;
- Investigating variances and tweaking processes or resources to achieve goals.
Companies often find using the SMART acronym will help with the key performance indicators.
- Specific purpose. Answers the who, what, where, why and which to make the goals specific.
- Measurable. Concrete criteria for measuring progress toward the attainment of the goal.
- Attainable. Is the goal attainable? Do you have the resources to reach the goal?
- Relevant. Are the goals relevant to your boss, team, and organization?
- Time. Set a time frame for reaching the goals.
Once the goals have been identified and you have solid key performance indicators, a business management system will help track those goals. Graphical reports and sorting/filtering capabilities keep managers updated as to the progress of those goals.
Data Integration
Data integration refers to the ability to import whatever data deemed necessary to analyze and create into visualizations, reports, or other forms of business intelligence. Data integration tools are the foundation of business intelligence, since BI functions would be impossible without first gathering data from multiple sources and compiling it together into one comprehensive platform.
Occasionally, these data integration tools are referred to as Enterprise Application Integration (EAI), Enterprise Information Integration (EII), or Extract, Transform Load (ETL). Use these tools with BI software to generate complex data centers.
Other Popular BI Features
Beyond the previously mentioned features found in BI systems, you’ll want to look for the following functionalities to ensure you have an adequate option:
- Data analysis: Inspect, cleanse, transform, and model data with the goal of discovering useful information, informing conclusions, and supporting decision-making.
- Predictive analytics: Uses historical data to predict what will happen in the future. Examples in everyday business include identifying customers to upgrade or remove services and focusing marketing campaigns on the right targets.
- Data mining: A practice of examining large databases in order to generate new information.
- Data discovery: The process of collecting data from databases and consolidating it into a single source that can be instantly evaluated.
- Dashboards: A visualization tool that displays the current status of metrics and KPIs for your business, based on your preferences (what numbers to show, what metrics to display, etc.). Reports and dashboards increase ease of use when reviewing information from multiple data sources.
- Data visualization: Patterns, trends, and correlations that place data into a visual context to help people understand.
- Financial modeling: The act of building an abstract representation of a financial situation.
Cost of BI Tools
Pricing of BI software is highly dependent on the number of users (the report creators and the viewers). Another primary cost factor is the size of data being stored in the program (file size) and how frequently you need this data updated (i.e. data grabbed from it’s sources such as your primary financial system). Similarly, choosing an on-premise or Cloud-based solution will affect the overall cost.
Some business intelligence software will advertise as low as $10/user/month, but these price plans are typically extremely limited, and are just designed to get users in the doors. When you look at adding on needed functionalities, the price of the software will increase.
While the following graph does not reflect any specific BI software pricing structure, it can be a great guide to look at the relation of user count to the most realistic price:
| Users | Lowest Monthly Cost | Highest Monthly Cost |
|---|---|---|
| 1-9 | $70/user | |
| 10-19 | $650/total | $3,500/total |
| 20-49 | $$1,100/total | $8,000/total |
| 50-99 | $2,500/total | $15,000/total |
| 100-249 | $4,300/total | $32,000/total |
| 250-499 | $9,200/total | $59,000/total |
| 500-999 | $16,300/total | $108,000/total |
| 1,000-4,000 | $29,000/total | $435,000/total |
| 5,000+ | $20/user | $80/user |
Of course, there are several free options available. Most developers understand business intelligence software is a tool every size of business can apply to their operations. Most free solutions offer a stripped down version of the paid software. Other plans offer a free base product with the ability to add features and functionalities as you go for a cost.
BI Tools for Reporting
Business intelligence tools boost efficiency, reduce costs, provide data integration and integrity, and allow for quicker recognition of actionable insights. All of this allows users the information needed to improve decision-making.
Real-Time Business Intelligence
Real-time BI tools let dashboards compare historic data with the most current data available. Predictive analytics are built on top of having real-time insight into your numbers, and will pull data from whatever source necessary (inventory, customers, services, and more).
Common uses of real-time BI are:
- Predictive analytics to find short-term improvements and establish long-term business goals
- Manufacturers monitoring production lines to check product condition
- Sales staff checking inventory levels to ensure they can fulfill an order or if a purchase order needs to be created
- Accounting staff preparing next years budget before year-end, grabbing today’s data along with any forecasts to finish out the year (and successfully create next-years forecast).
Financial Indicators
Financial indicators allow management to see where they stand for the day, month, quarter, and year. Through a business intelligence software, management will also have the ability to review the financial data for the year but also look at and compare the current year to previous years. In addition to looking at past data, business intelligence tools also create projections based on the past performance showing potential outcomes.
- Quantitative indicators are a measurable characteristic, resulted by counting, adding, or averaging numbers. Operational systems that manage inventory, supply chain, purchasing, orders, accounting, financial systems, all gather quantitative data by means of KPIs.
- Qualitative indicators are not as easily measured. Qualitative indicators are a descriptive characteristic, an opinion, a property or a trait. The most common ones gauge customer or employee satisfaction through surveys. While the survey data itself is quantitative, the measures are based on a subjective interpretation of a customer’s or employee’s opinions.
Non-Traditional Types of Business Intelligence
Analytics platforms can provide you with data or trends on whatever platform you desire. And while business intelligence is commonly associated with financial insights (such as for budgeting purposes), the core functionality of any BI tool is the ability to collect raw data. In terms of marketing insights and social media, this can mean customer demographics, behaviors, and search habits. For businesses on the go, it could mean needing access on mobile devices.
Social Media BI
While BI isn’t going to necessarily make sales for you, it will help you nurture existing relationships with your base, whether it’s direct consumers or other businesses. Developing profiles of the buyers your company is targeting used to consist of surveys, focus groups, and other forms of interaction that once required a lot of time and user engagement. Business intelligence software automatically gathers real-time marketing insights about customers so you no longer have to comb through the results manually.
Most importantly, social media will help you find clusters of people with similar interests and sort them based on their age, income, gender, and more. This can be vital information for marketers who want to connect to the people most interested in their products.
Self-Service BI
Business intelligence modules were initially designed for data preparation and visualization at large companies. The focus was to take all the raw data locked up in financial and operations systems and turn it into useful business information. While this software has been readily available for years for large companies, BI modules targeted toward small to mid-sized businesses are new to the market. These self-service options are able to be utilized by the business themselves rather than needing an IT team to make sense of the data.
Self-Service is all about providing a business with the analytical tools they desire with ease of use at a lower cost. These options will be less technical than their high-end counterparts, and thus easier for someone with little to no IT or technical skills to handle. This will come at the expense of functionality, however, smaller businesses seem to enjoy the autonomy and independence it provides.
Mobile BI
BI is about having the right data at the right time. That could mean wanting that data when you are out of the office. The rise of smartphone technology has allowed BI software developers to create apps or extensions of their program and let key decision makers get the insights they desire in real-time.
Common Comparisons of BI Terms
There’s a lot of jargon thrown out there when it comes to Business Intelligence. What does one term mean in relation to another? Don’t some of these terms mean the same thing?
- Business Intelligence vs Data Analytics: Think of business intelligence as the decision making phase, while data analytics is the process of asking questions. You first need to have analytics before you end up with business intelligence. Once this step has been taken care of, BI tools help make sense of what the analytics have told you.
- Big Data vs Business Intelligence: You can think of business intelligence as a knife and big data as a loaf of bread. Big data is as the name implies; data, and is a substance that won’t be of much value without anything being put into action. BI is just that–action! BI becomes the process that takes your big data and arrives at conclusions or valuable business insights.
- Enterprise Performance Management (EPM) vs Corporate Performance Management (CPM): Both evolving from BPM (business performance management) in the early 2000s, EPM vs CPM may seem like a useless debate, but the differences exist. CPM is a corporate-wide solution that focuses strongly on finance, while EPM focuses on performance across all areas of an enterprise. EPM is a field of business performance management which considers the visibility of operations in a closed-loop model across all facets of the enterprise. In the world of software, it helps the end-user (company) tie together their plans, strategies, and execution. This includes budgeting, consolidating, reporting, and analyzing. CPM solutions manage a corporation’s performance based on KPI’s such as revenue and ROI.
What Does Your Business Need?
Business intelligence software is used in virtually every industry. Some examples include:
- Consulting firms need to track project information. They need to see productivity by employee along with statistical data about each project.
- Retailers need to track profitability by SKU, set goals of how many units to sell per hour to be profitable on a given day.
- Financial institutions set goals for their personal bankers as to how many accounts each banker opens during a month. Beyond the number of accounts, what type of accounts and the amount of new money brought into the financial institution.
BI Tools used to be a privilege of big companies, as implementing analytics software required building data centers and hiring IT specialists. With the emergence of the cloud and more cost-effective methods become more available, BI has begun to rise in businesses of all sizes as businesses begin to make faster decisions with real-time analytics.
Nearly every accounting software available has reporting tools. Some solutions offer budgeting functionality integrated into their accounting software, and there are also stand-alone solutions.
Often, the financial reporting and budgeting modules are not integrated and gathering reports from these modules requires time-intensive data mining to obtain the necessary information. They also may not include data visualization options that allow for better insight.
Depending on the size of your business, you’ll need to focus and prioritize on different aspects.
New Buyers and Small Businesses
These buyers will focus on financial reporting that goes beyond what their existing general ledger reports can give them. Most small companies will struggle with implementing any big-name BI tool due to a lack of resources.
Small companies will benefit the most from a software they can implement in the short-term. A software that allows for self-service BI with ad-hoc querying will let you grab the data when it’s most convenient.
This can be a SaaS-based tool that will integrate with their existing software (such as their accounting software). This type of solution may not be the best fit for a growing company but will be the most cost-effective method until a future time allows for the re-evaluation of company software methods.
Existing Users Desiring Upgrades to Functions Beyond Basic Reporting
These buyers will move from simple reporting tools to complex analytical ones. Buyers generally look for a BI upgrade when their current solution provides insufficient reports, processes are running slow, or the reports and analysis are no longer viable due to an increase in the volume of data. The business may have also experienced a shift in the direction for revenue, which requires a change in their analytical approaches.
Large Companies
The level of customization involved is often what sets enterprise-level BI software apart from small to mid-size offerings. Often enterprise level BI systems will require the data warehouse to be custom designed to handle the quantity of data they desire. They may also require IT staff to be available to handle the amount of hardware or in-house system integrations they need, possible with an ERP platform. The best approach may be going with a handful of different BI platforms and consolidating them together to meet every department’s needs, as standardizing enterprise BI has a number of challenges.
Pain Points of BI Tools
When searching for business intelligence software, companies focus on key areas where their current solution falls short. What are users of BI tools saying when they search for new options?
Industry Confusion
At times, much of the insight a business may be looking to gain from BI tools may be industry specific. The software option, or perhaps the vendor that implements it, may be unable to help a company achieve their full potential with the software.
Selecting the Right Visualizations
Half of the battle in reporting data is how you are presenting it to the individuals in your company. Your main goal should be to engage the viewer, communicate data, and elicit appropriate responses from the target audience. This can be accomplished with different types of visuals. Choosing incorrectly could be the nail in the coffin that disengages your audience, and doesn’t allow you to spread the desired message.
Visual BI must provide the following core common capabilities:
- Aggregation of large data sets into a comprehensible whole,
- An appropriate emphasis of top KPIs,
- Clear display of data trends over time,
- Support for logical data segmentation to convey the role of parts to the whole,
- Comparisons of actual results to expected or desired standards, and
- Support for combinations of data, text, and images which simplify the consumption of complex information.
Lack of Mobile Solutions Available
Businesses desire the ability to add storage capacity. Others look to have a wide user adoption at their company, which can be difficult for certain employees who are frequently on the go and don’t have access to a desktop computer during the day. Mobile devices are becoming more commonly found among workers in the field, and access to key reports no matter where an employee is can help.
Trends in Data Visualization
What trends are taking over the world of business intelligence? Whether you’re trying to get a simple forecast for your company budget, or looking for improved metrics on the profitability of your sales staff, these are some of the hottest topics.
Large Companies Want Business Intelligence
In a recent review of over 3,000 software projects from 2017, businesses with 50+ employees are more than 70% more likely to need software that handles budgeting/business intelligence (BI) and fixed assets.

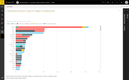
Strong Inventory Features
BI tools have expanded immensely to break down more than your financials. In the world of inventory, it can help answer questions such as “Which brands are the most popular? What colors or sizes tend to move the most? What products to people buy in tandem and should be recommended for upselling?” From there, you can improve your product-handling to faster address pending RMA’s, transfers, back orders, and more.
Big Data on the Rise
Wikibon projects the Big Data market will surpass $84B by 2026. This was after the Big Data market reached $27.36B in 2014, up from $19.6B in 2013.
70% of BI Users Are Casual or Standard Users
This means a large chunk of BI users have a limited skillset. Power users consist of 25% of all users. These types of users are skilled to analyze data and create reports and dashboards from scratch.